Every raise eaten by higher costs? Here's the proof, updated.
All 17 charts from Demystifying Money, in book order, so you can follow along as you read or listen. Where the data keeps moving, the book chart sits next to the same chart updated to October 23, 2026. Same lines and the same units, just more years.
Get the book on AmazonJump to a chart
- Act 7: U.S. National Debt by Decade & Half-Decade (1903–1983)
- Act 9: Mortgage comparison: before 2000, after 2000, and 2003 FHA
- Act 9: Bankruptcies and Foreclosures in the US (2006–2012)
- Act 9: Currency in Circulation in the US (1850–2022)
- Act 9: Projected Bitcoin Supply Over Time (2009–2140)
- Act 9: Bitcoin Price by Date
- Act 10: Average US Home Price (2000–2026)
- Act 10: M2 Money Supply & S&P 500 Index Values (1913–2023)
- Act 10: Estimated US Annual GDP vs. Federal Debt (1900–2023)
- Act 10: US GDP and Debt (1870–1913)
- Act 11: US Federal Debt, Consumer Debt, and Tax Revenue (2000–2026)
- Act 11: US Personal Savings vs. Interest on Debt (2000–2026)
- Act 11: Israel Inflation (1970–1990)
- Act 11: Israel Inflation Applied to US Debt vs. a 30% Max-Inflation Scenario
- Act 11: Buying Power of $1 Million: Original Inflation vs. 10% Investment Return
- Act 11: Comparison of Internet, WWW, and Bitcoin Adoption from Year 1
- Act 11: Value of 2 BTC Over Time (Feb 9 each year)
Act 7 · Chart 1 of 17
U.S. National Debt by Decade & Half-Decade (1903–1983)
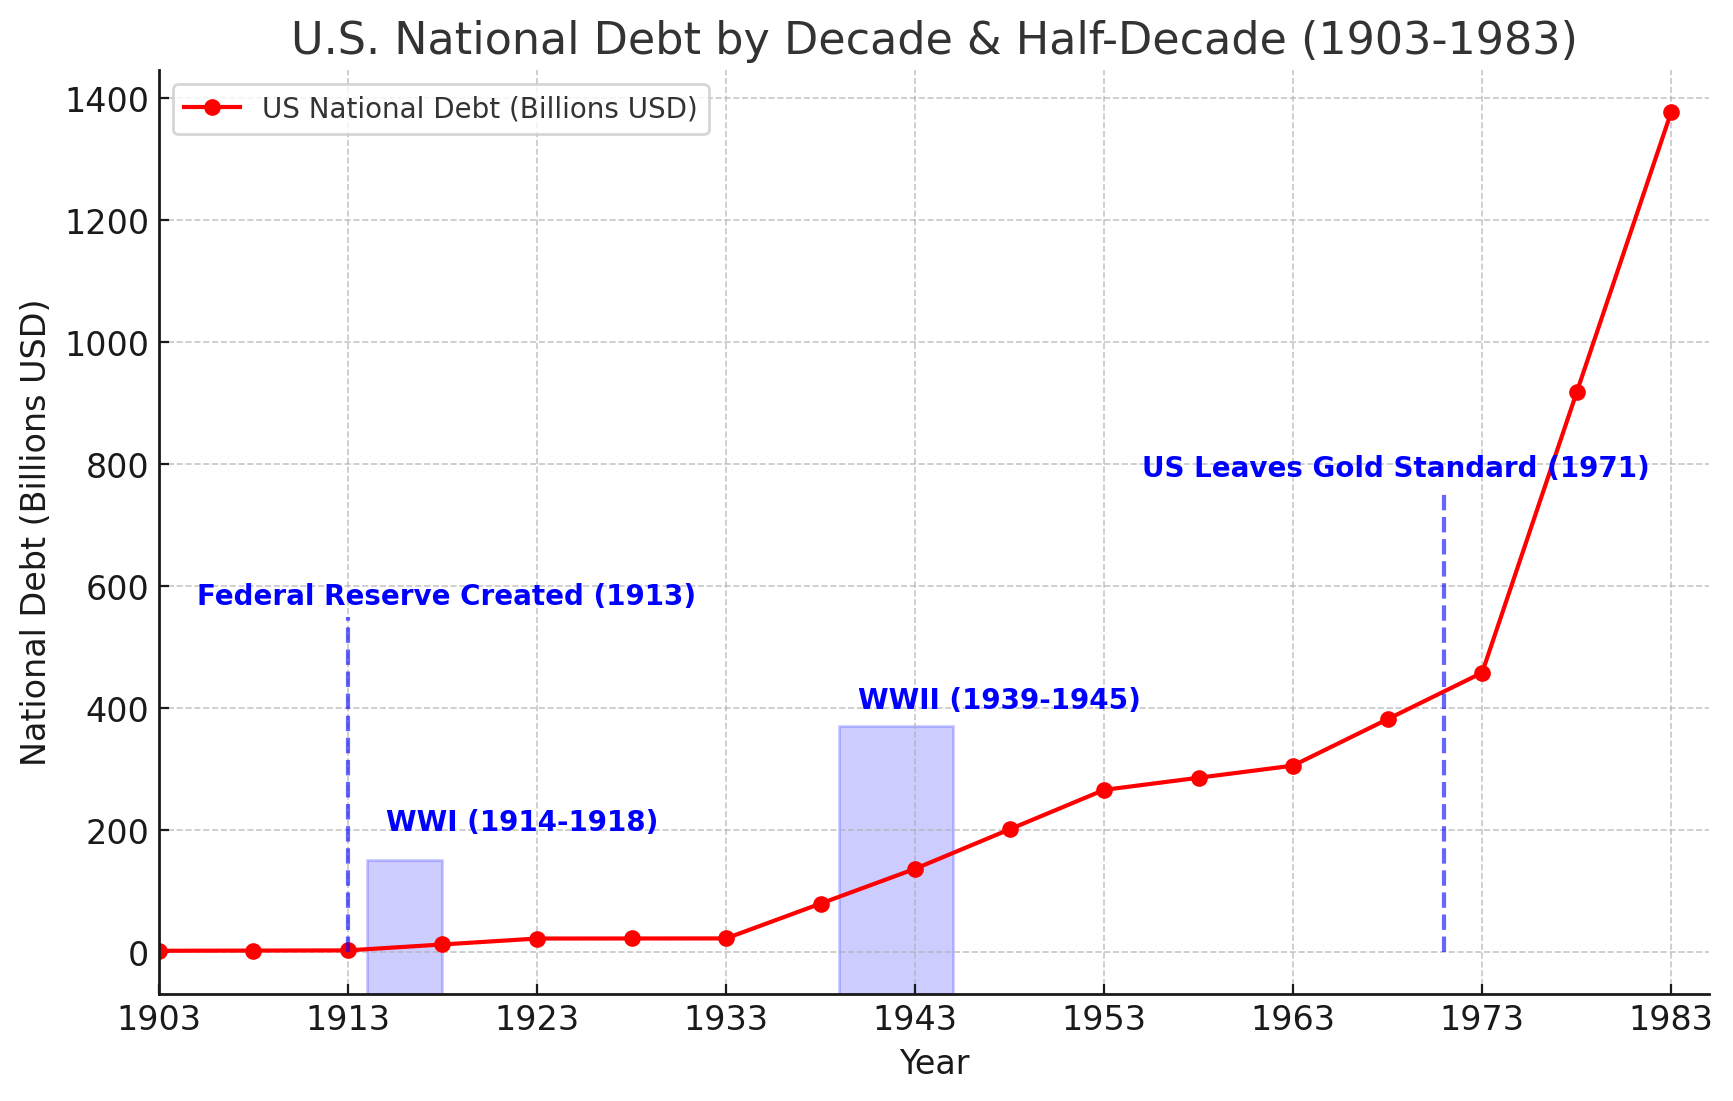
Historical chart: this period is complete, so the book version stands as is.
Act 9 · Chart 2 of 17
Mortgage comparison: before 2000, after 2000, and 2003 FHA
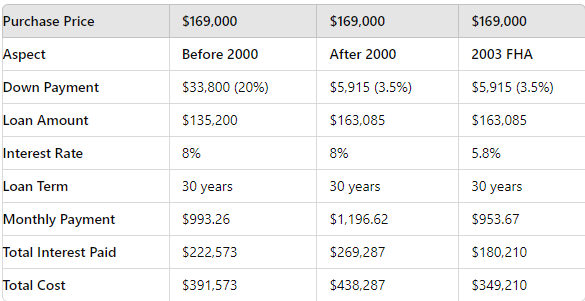
Historical example from the early-2000s housing boom. Fixed in time, so no update is needed.
Act 9 · Chart 3 of 17
Bankruptcies and Foreclosures in the US (2006–2012)
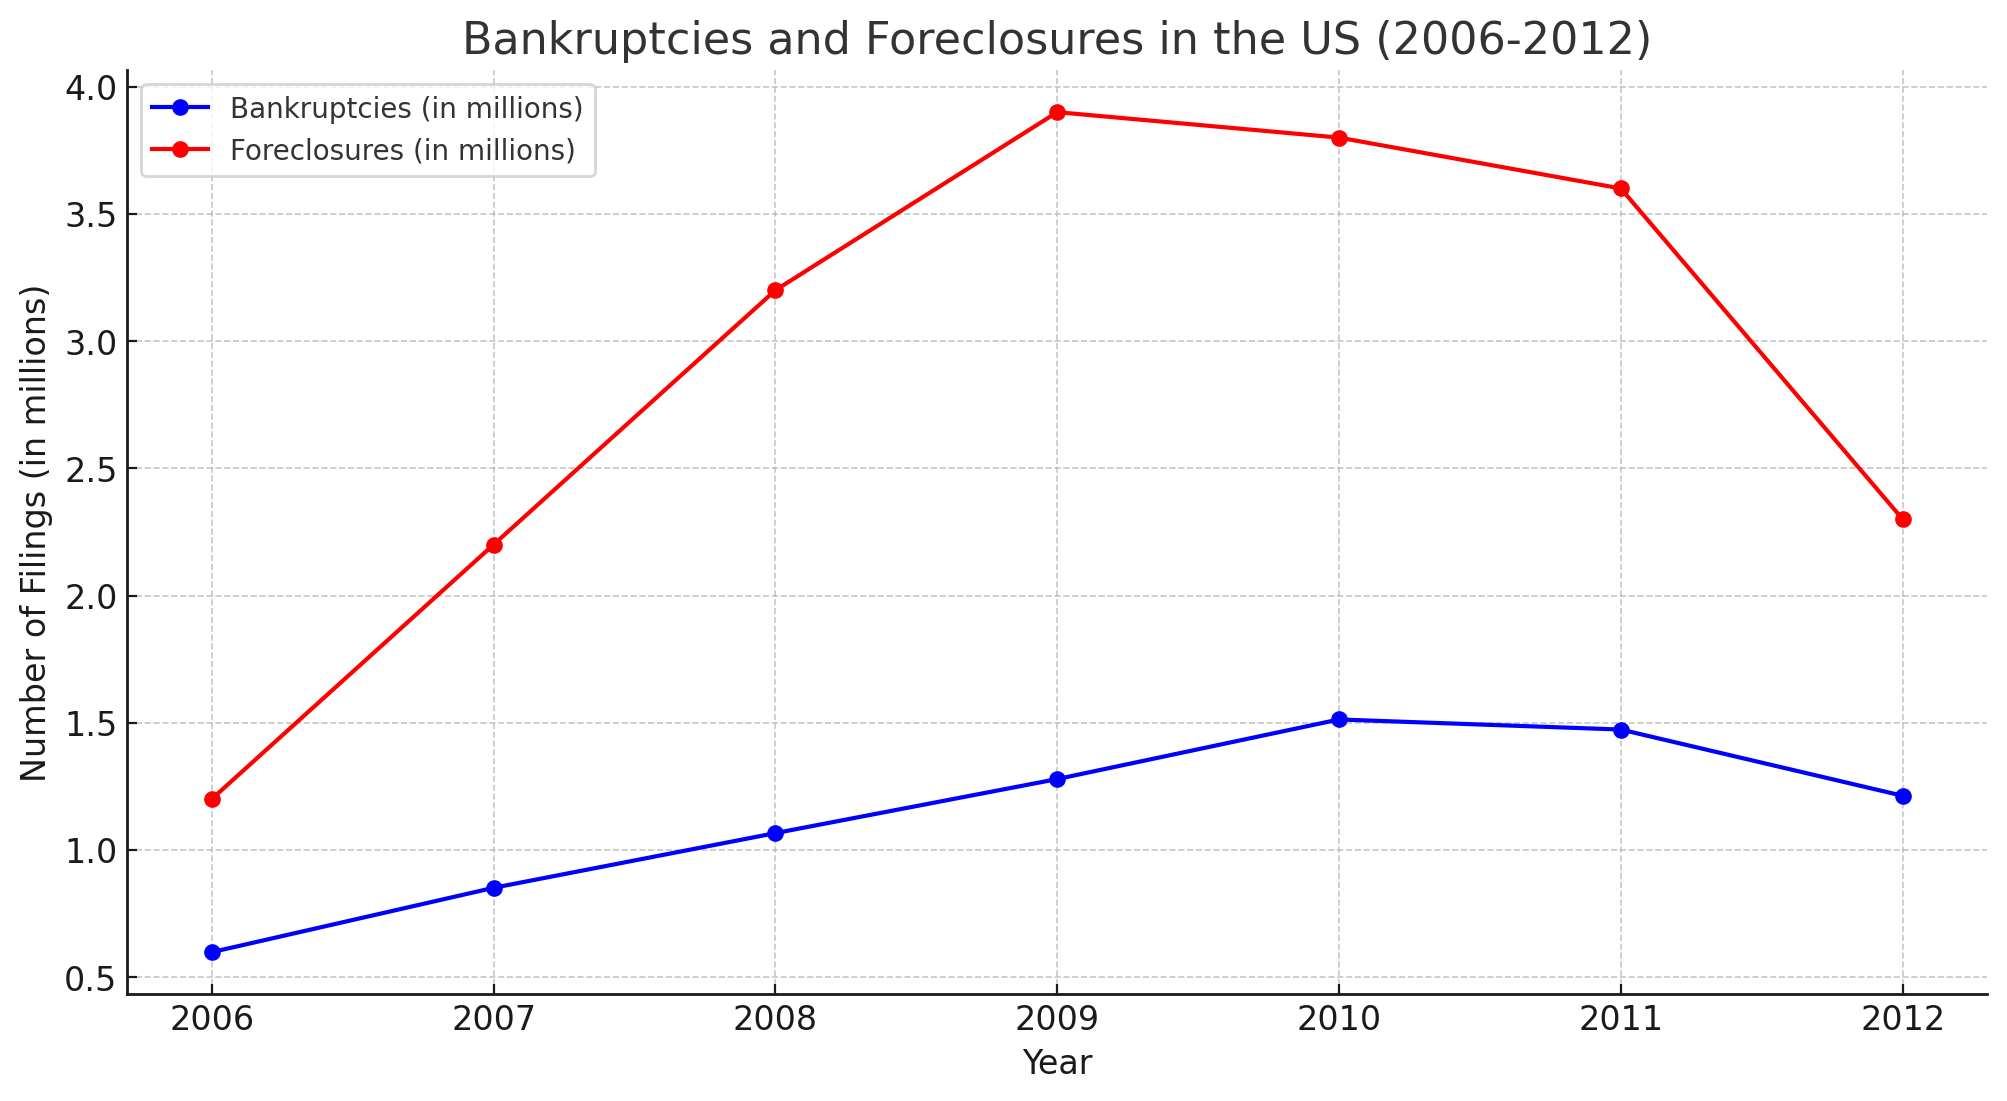
Historical chart covering the 2008 housing crisis.
Act 9 · Chart 4 of 17
Currency in Circulation in the US (1850–2022)
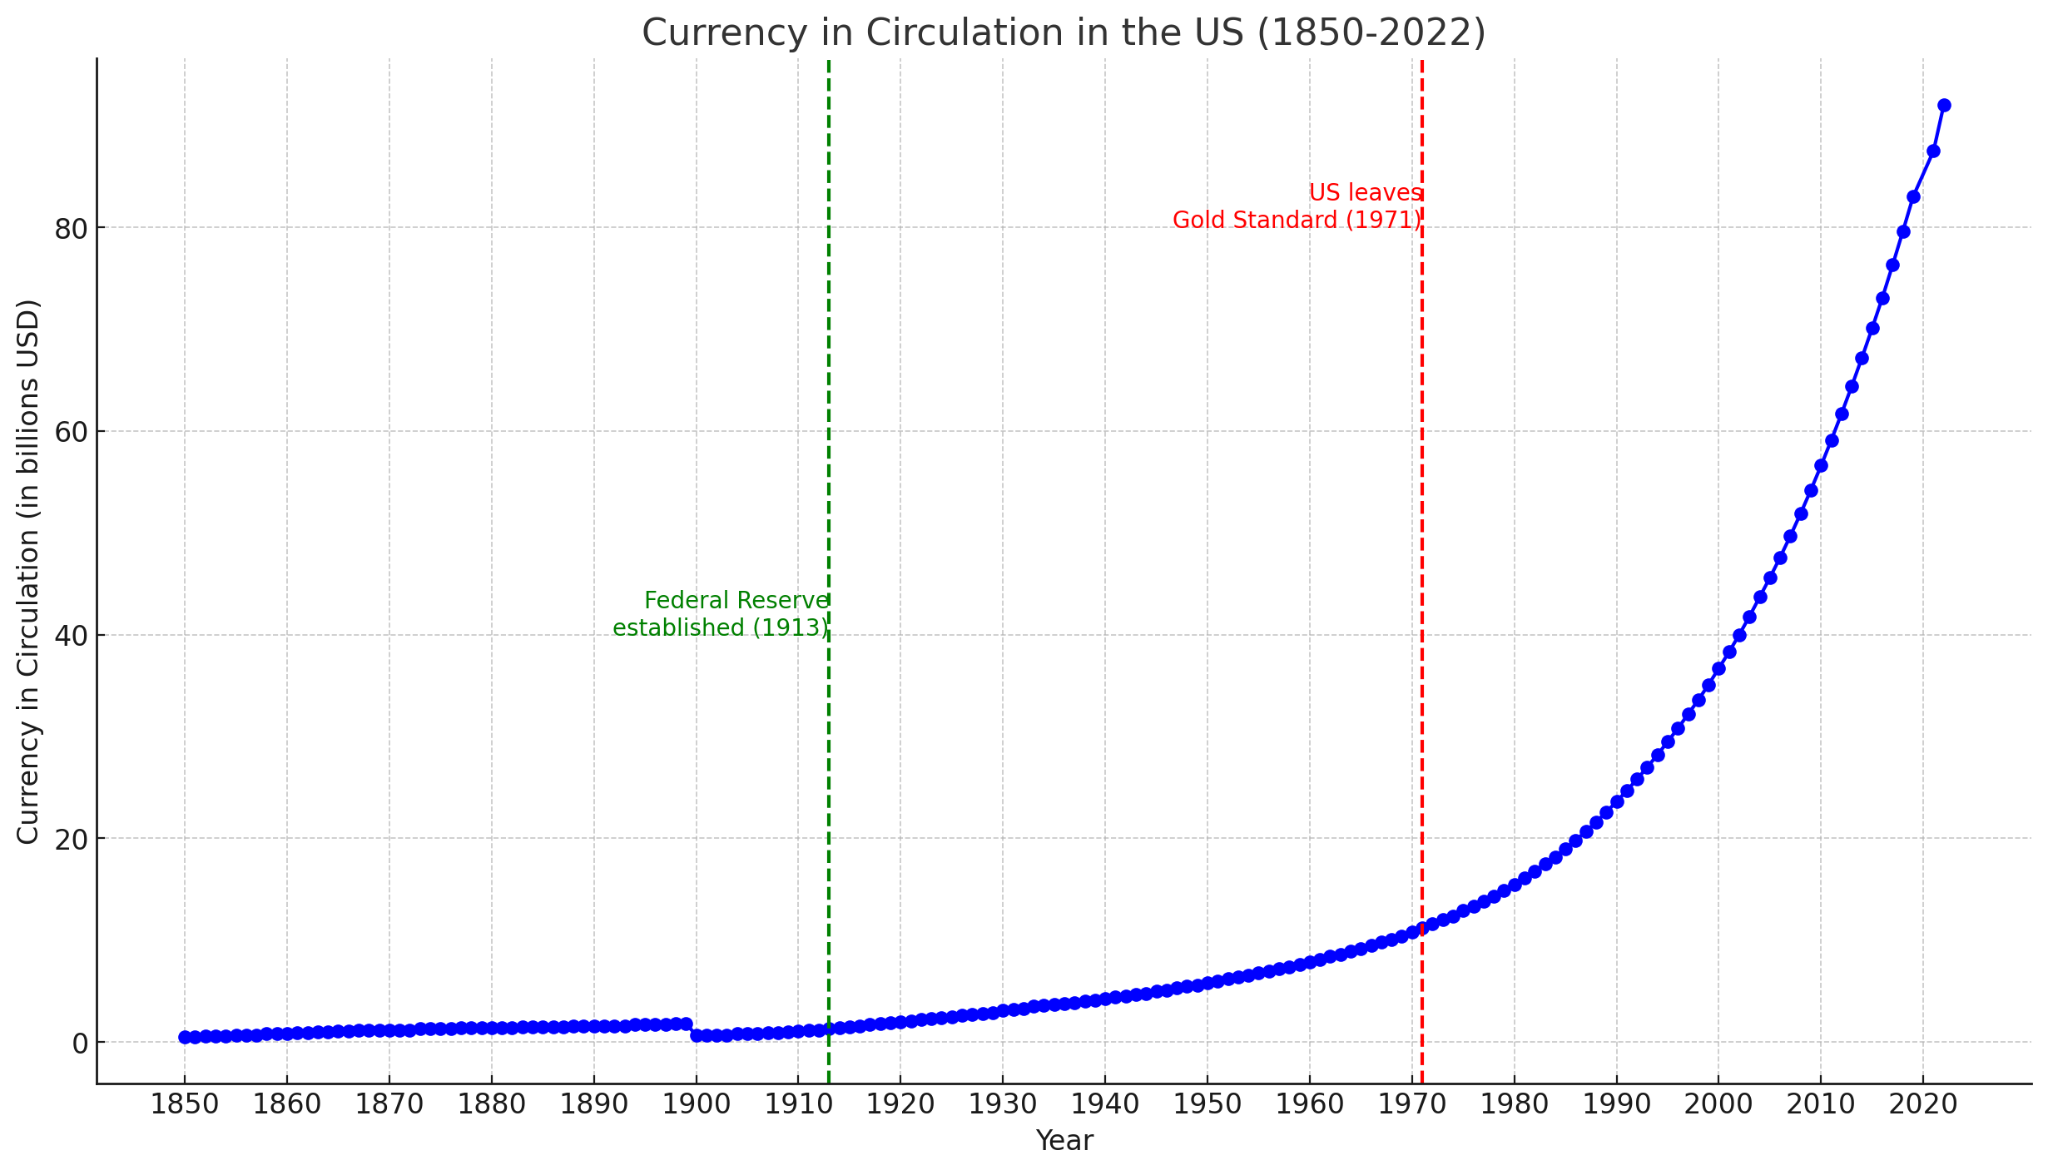
Updated version coming soon. We're confirming the original data source before extending it.
Act 9 · Chart 5 of 17
Projected Bitcoin Supply Over Time (2009–2140)
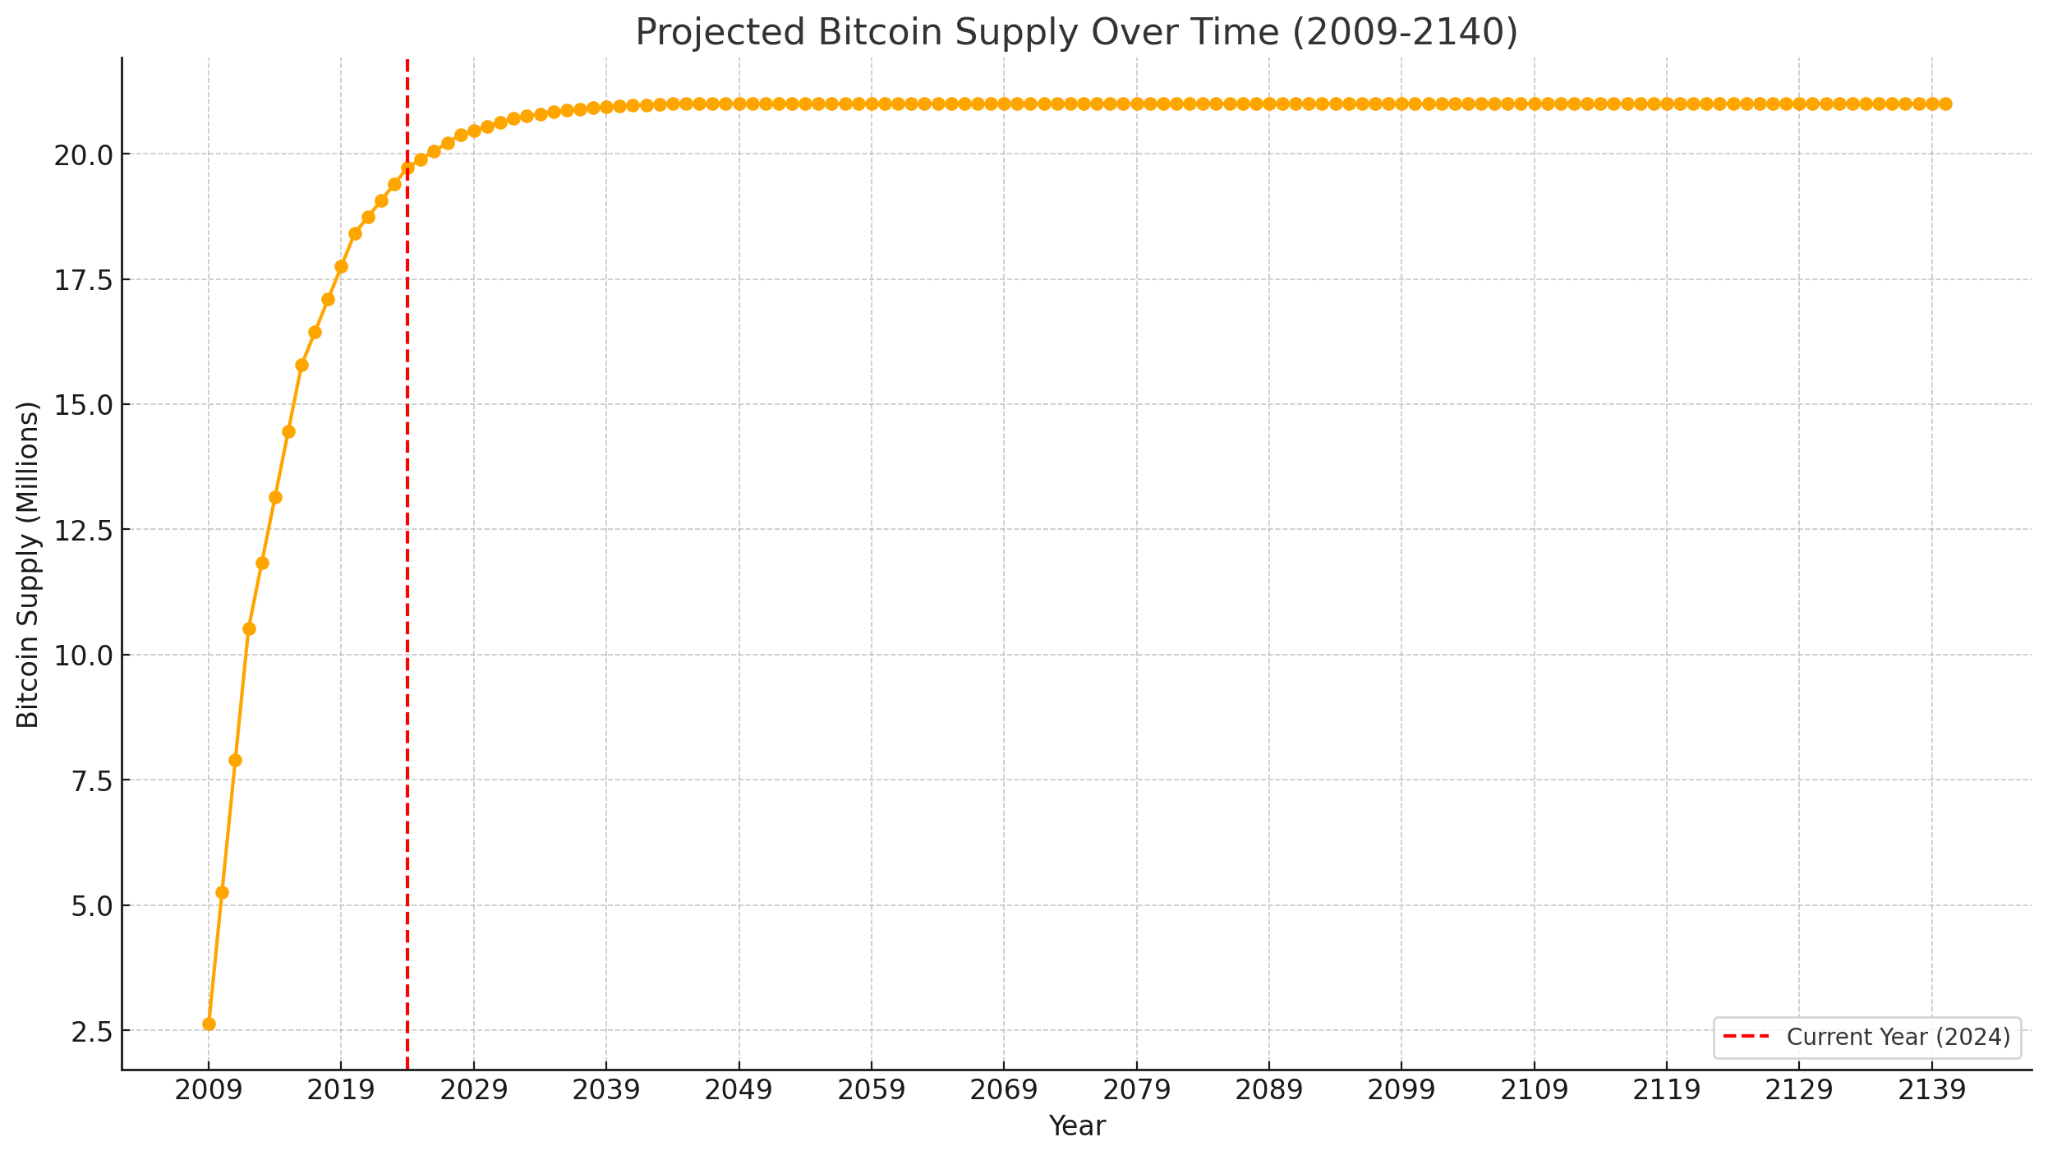
No update needed: Bitcoin's programmatic supply schedule (capped at 21 million coins through 2140) is fixed in code and unchanged.
Act 9 · Chart 6 of 17
Bitcoin Price by Date
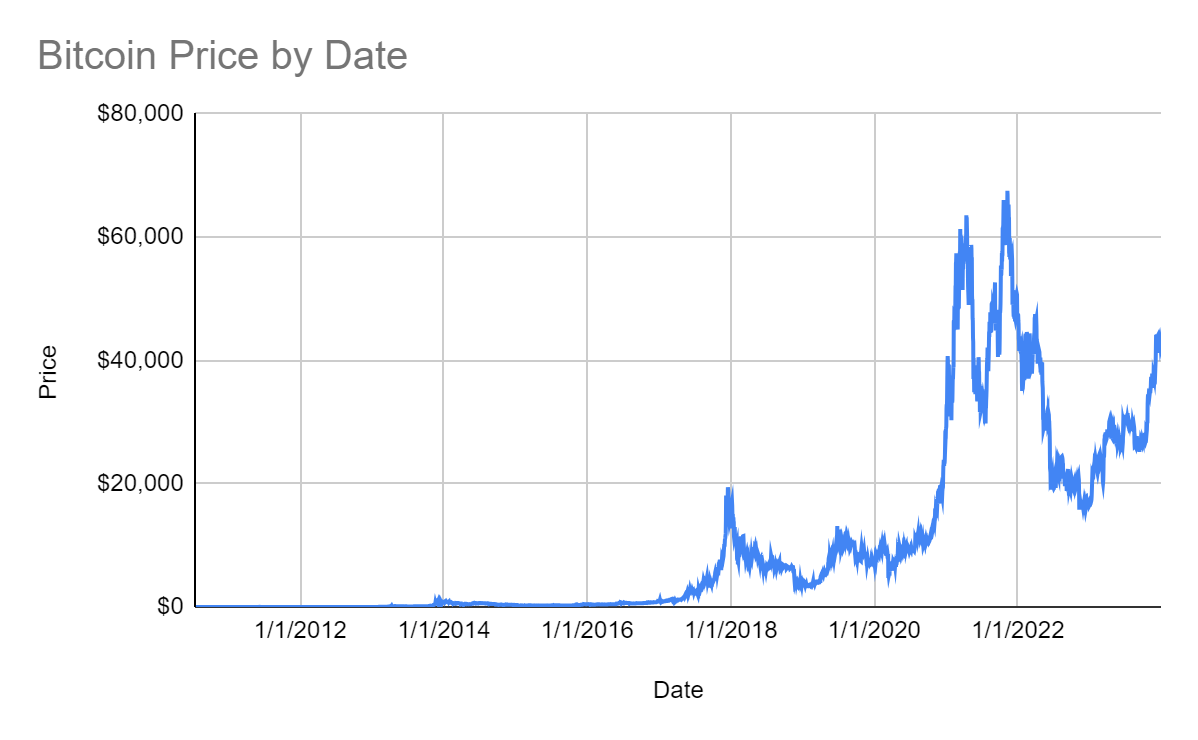
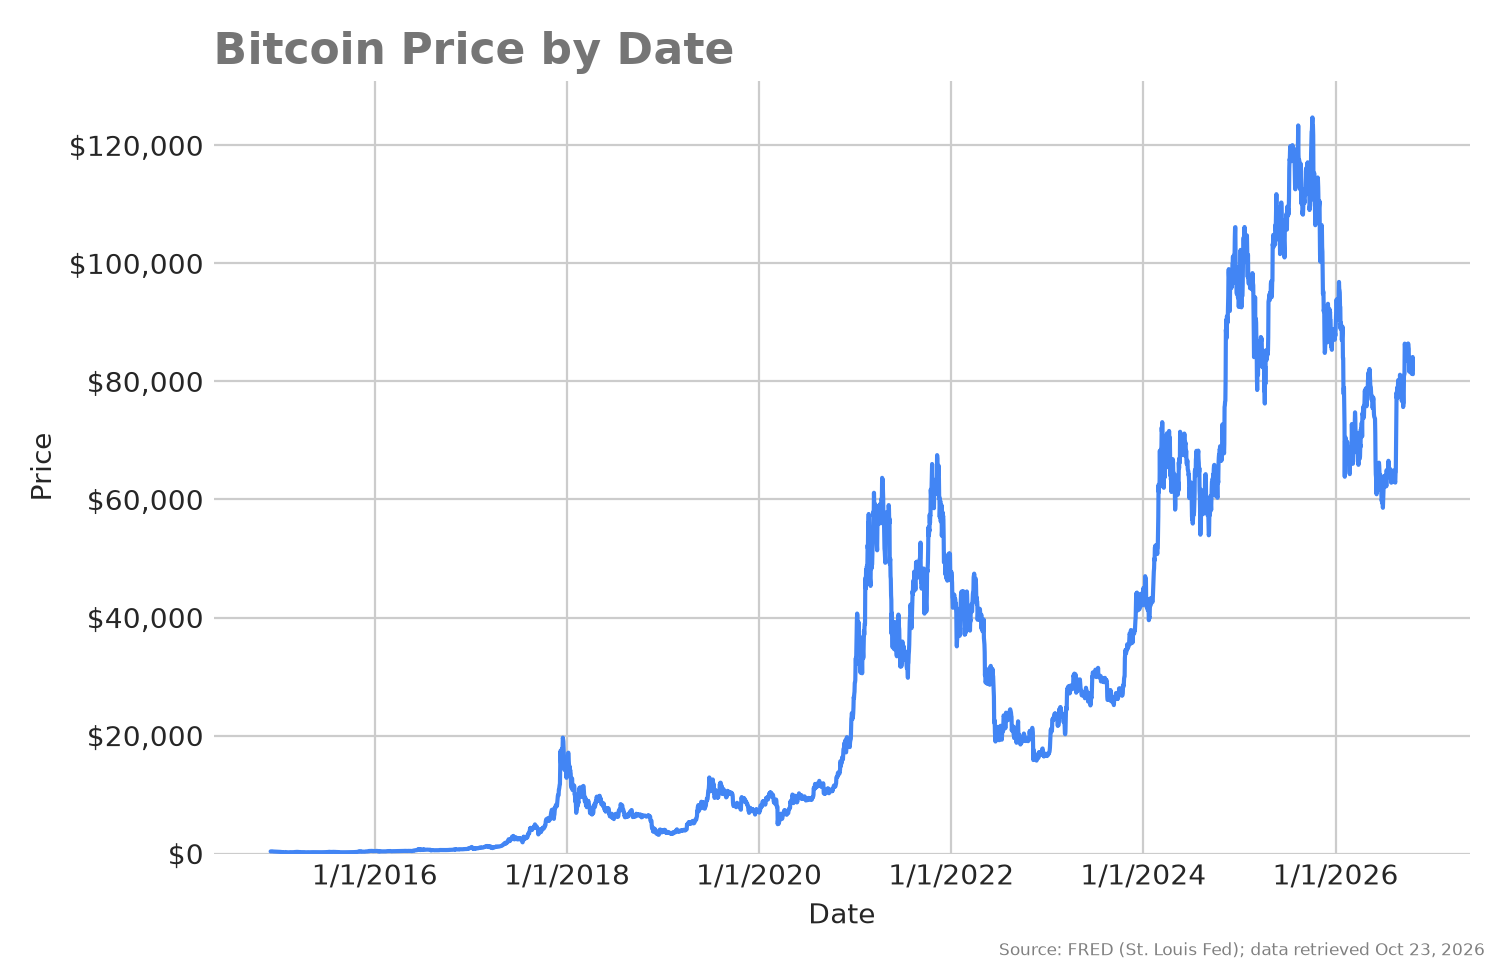
Updated through Oct 22, 2026. Past performance is not indicative of future results.
Act 10 · Chart 7 of 17
Average US Home Price (2000–2026)
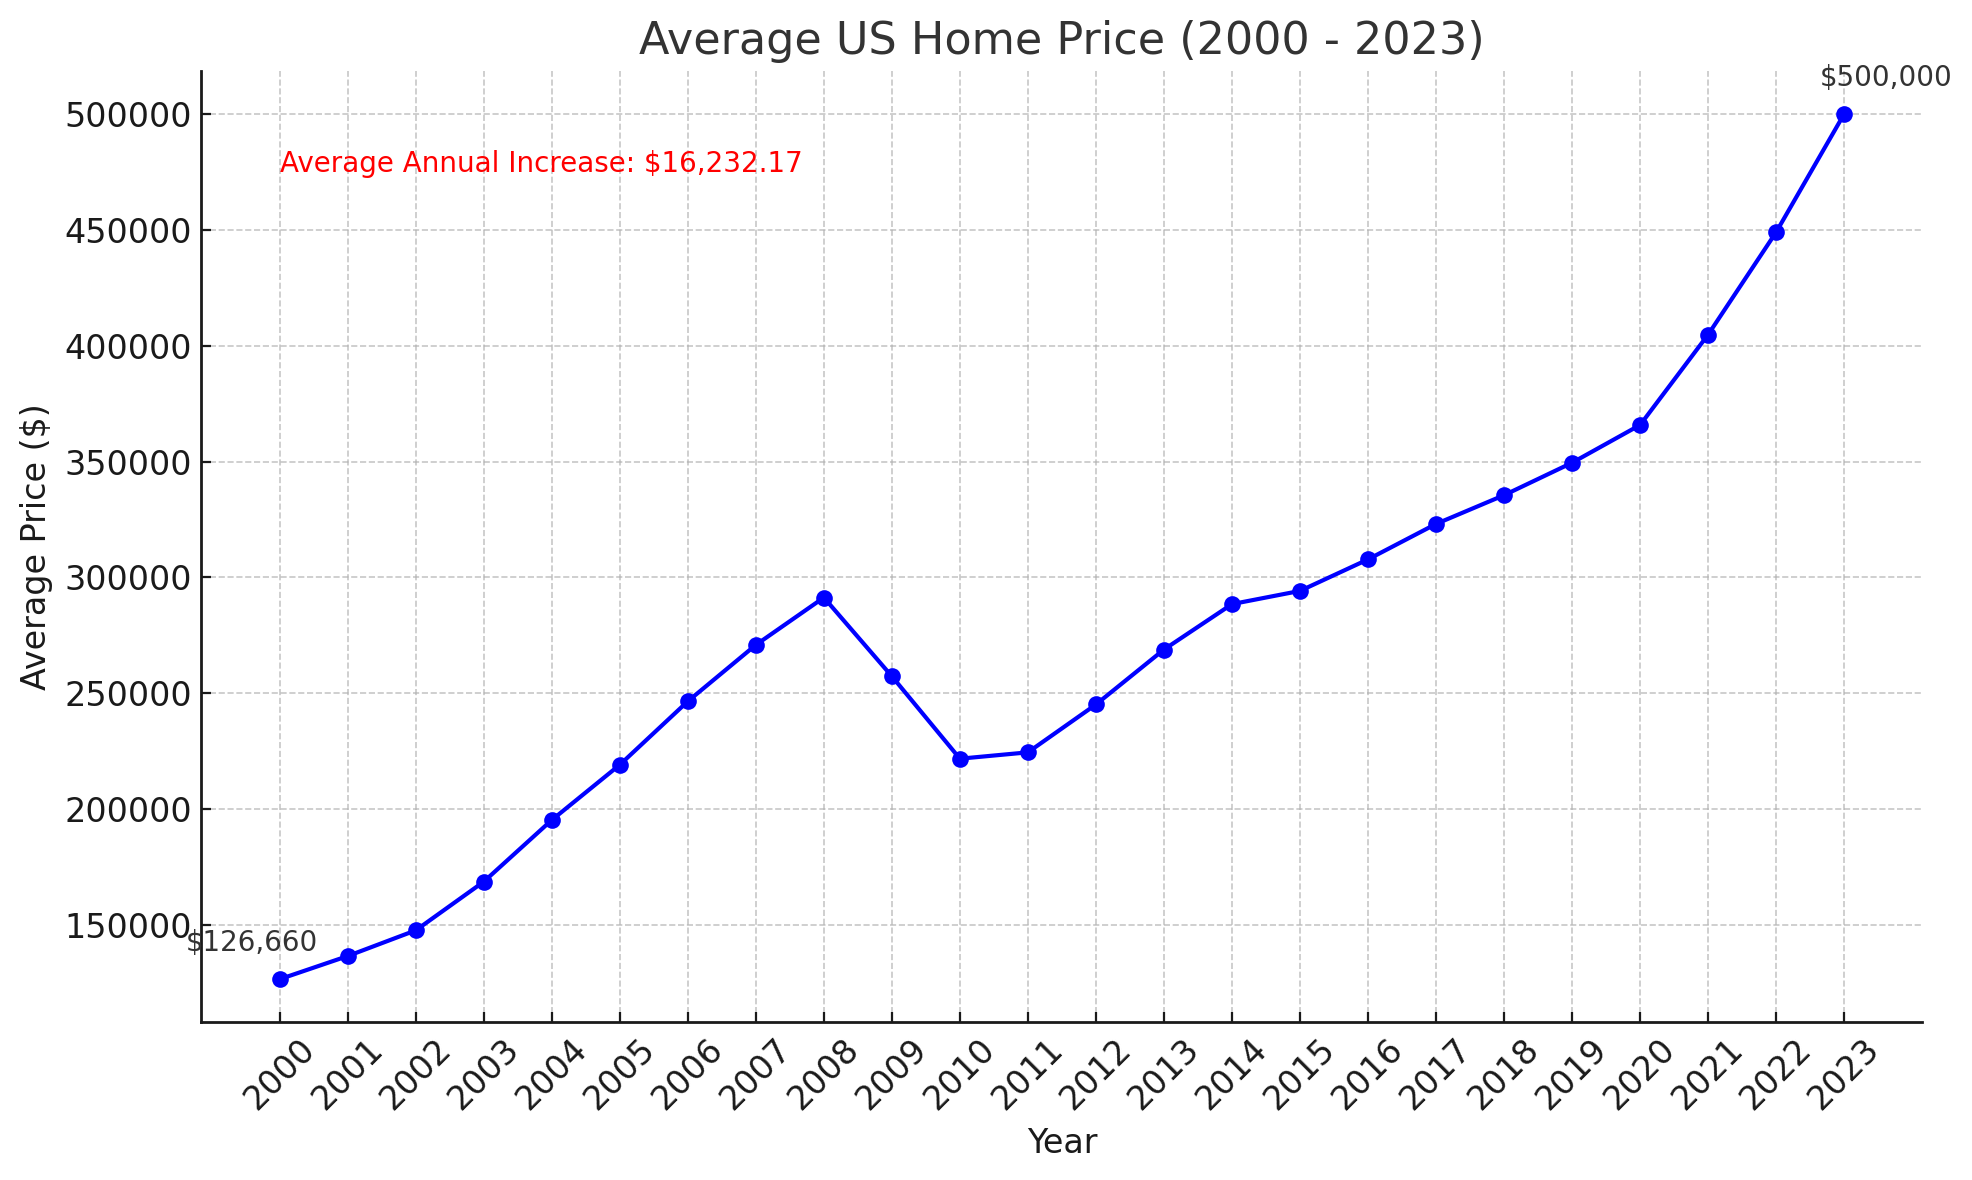
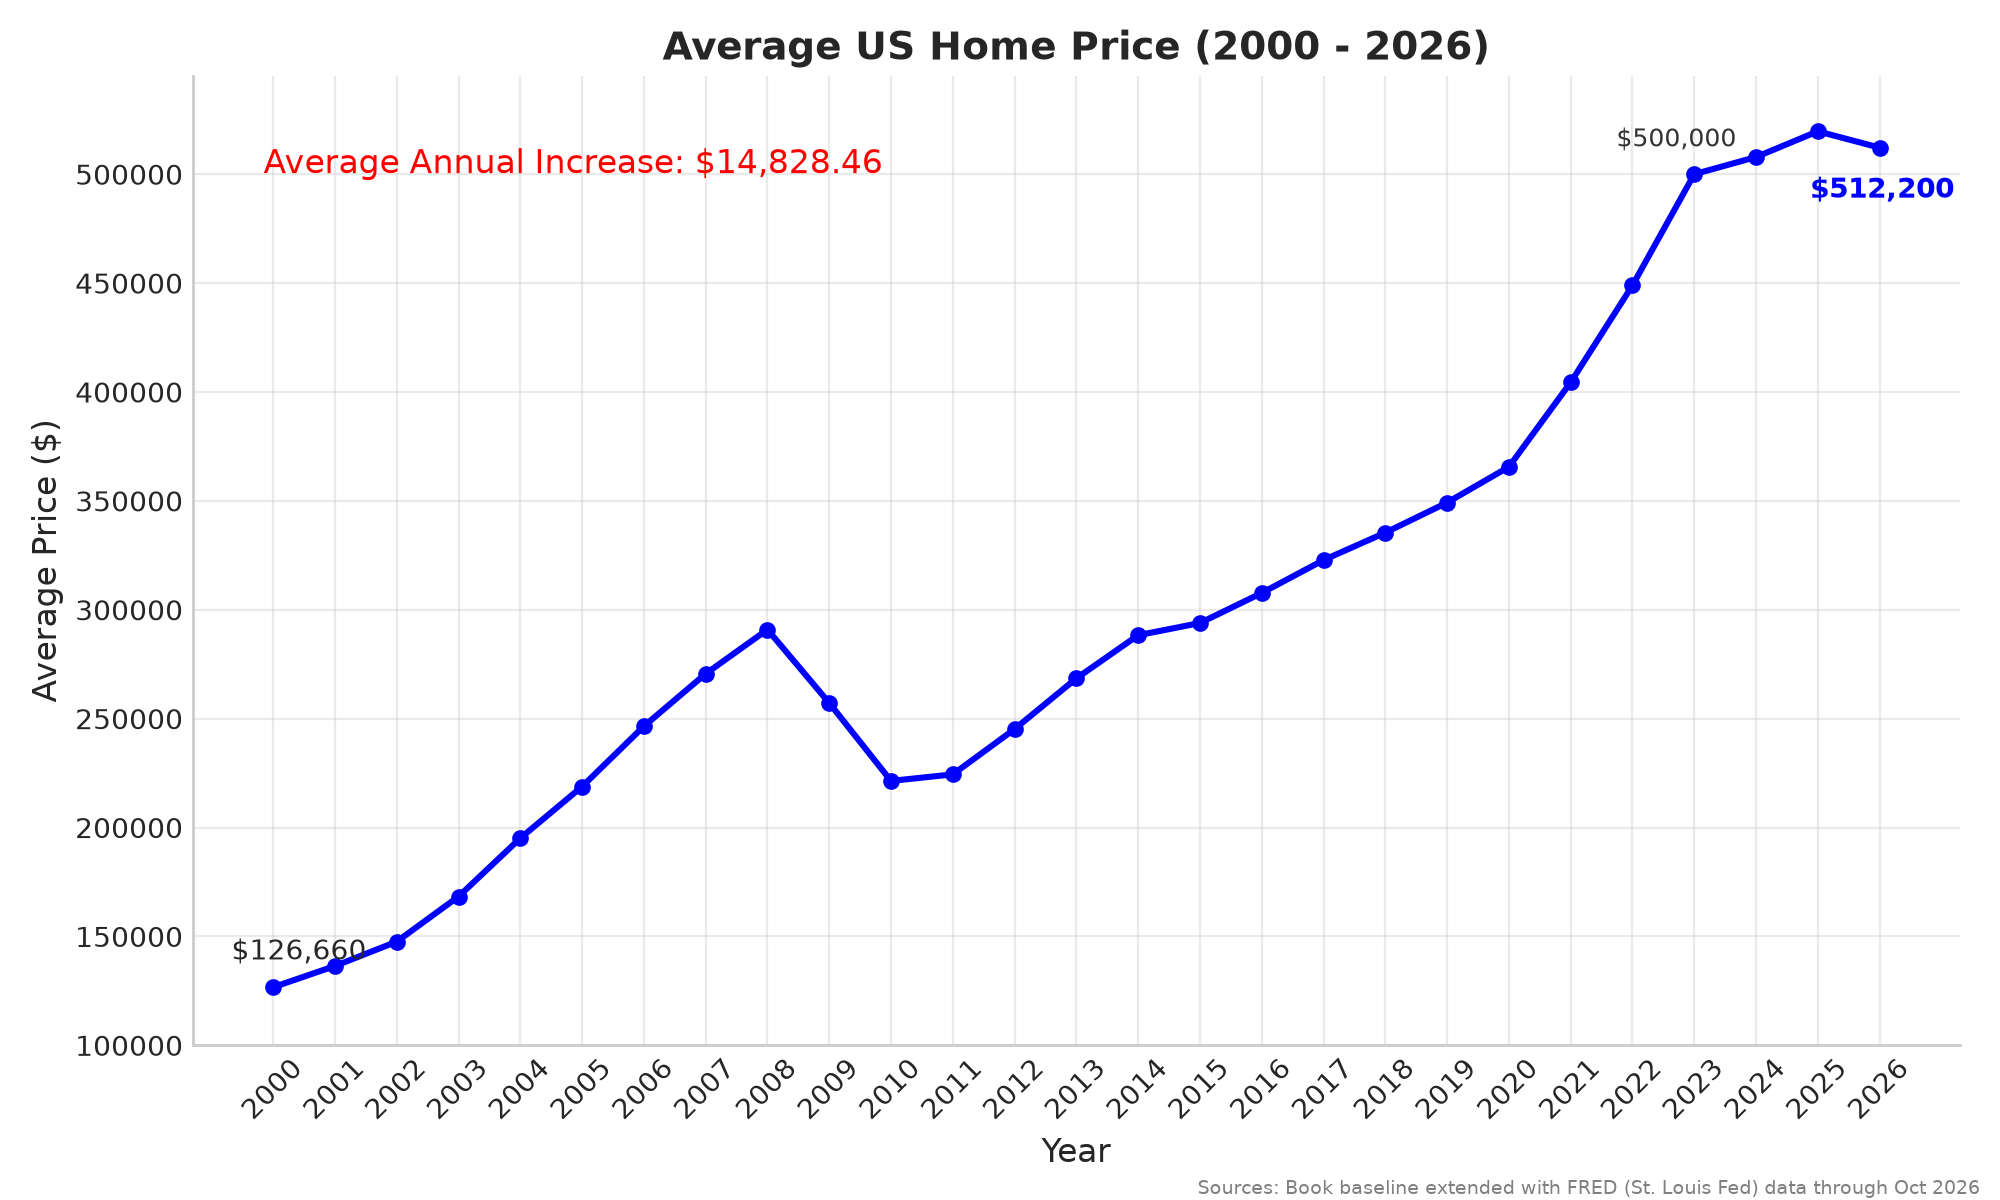
The average home sold for about $126,660 in 2000. In 2026 it's above $500,000.
Act 10 · Chart 8 of 17
M2 Money Supply & S&P 500 Index Values (1913–2023)
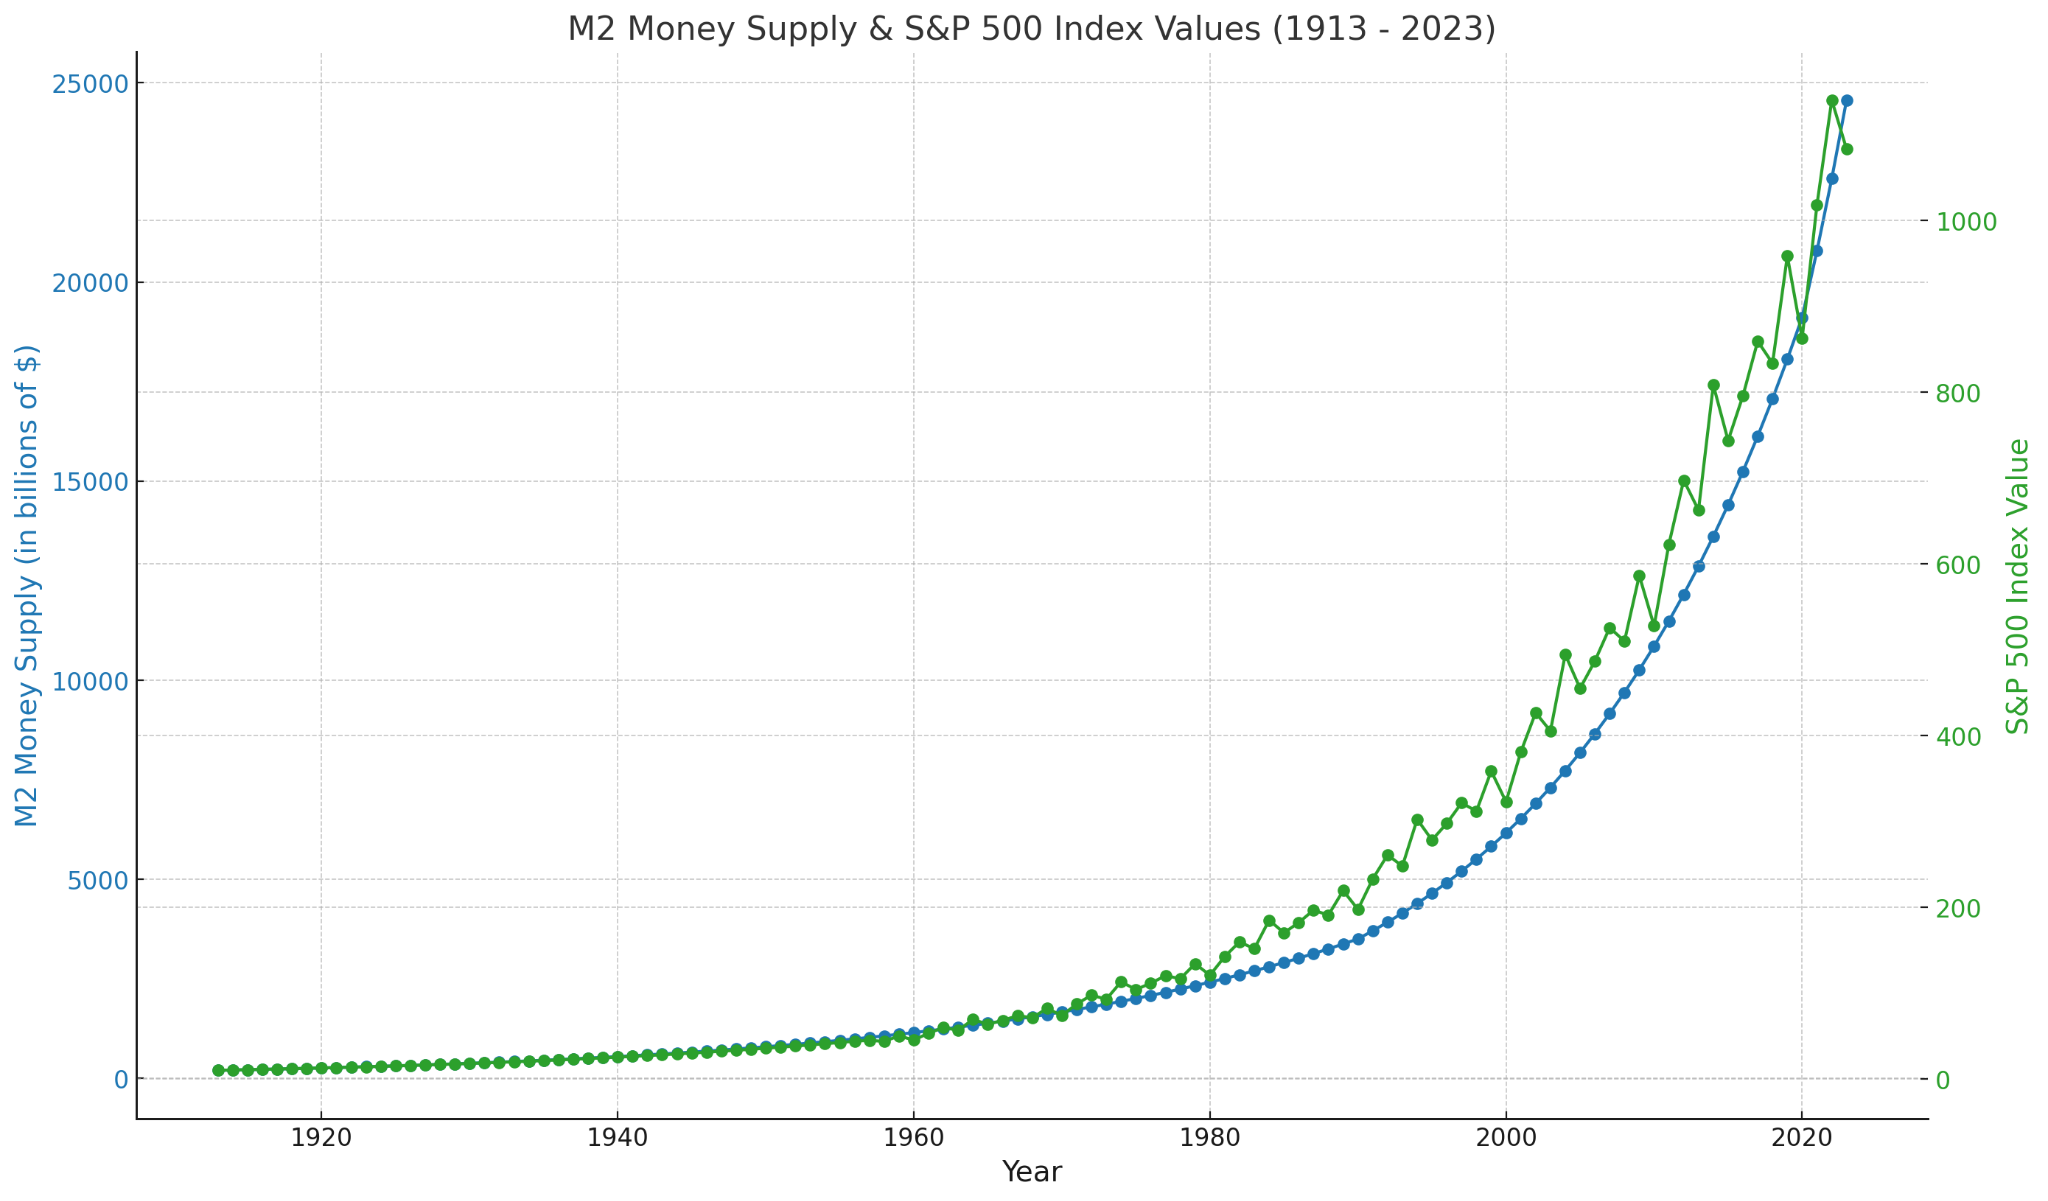
Updated version coming soon. We're sourcing a long-run S&P 500 series back to 1913.
Act 10 · Chart 9 of 17
Estimated US Annual GDP vs. Federal Debt (1900–2023)
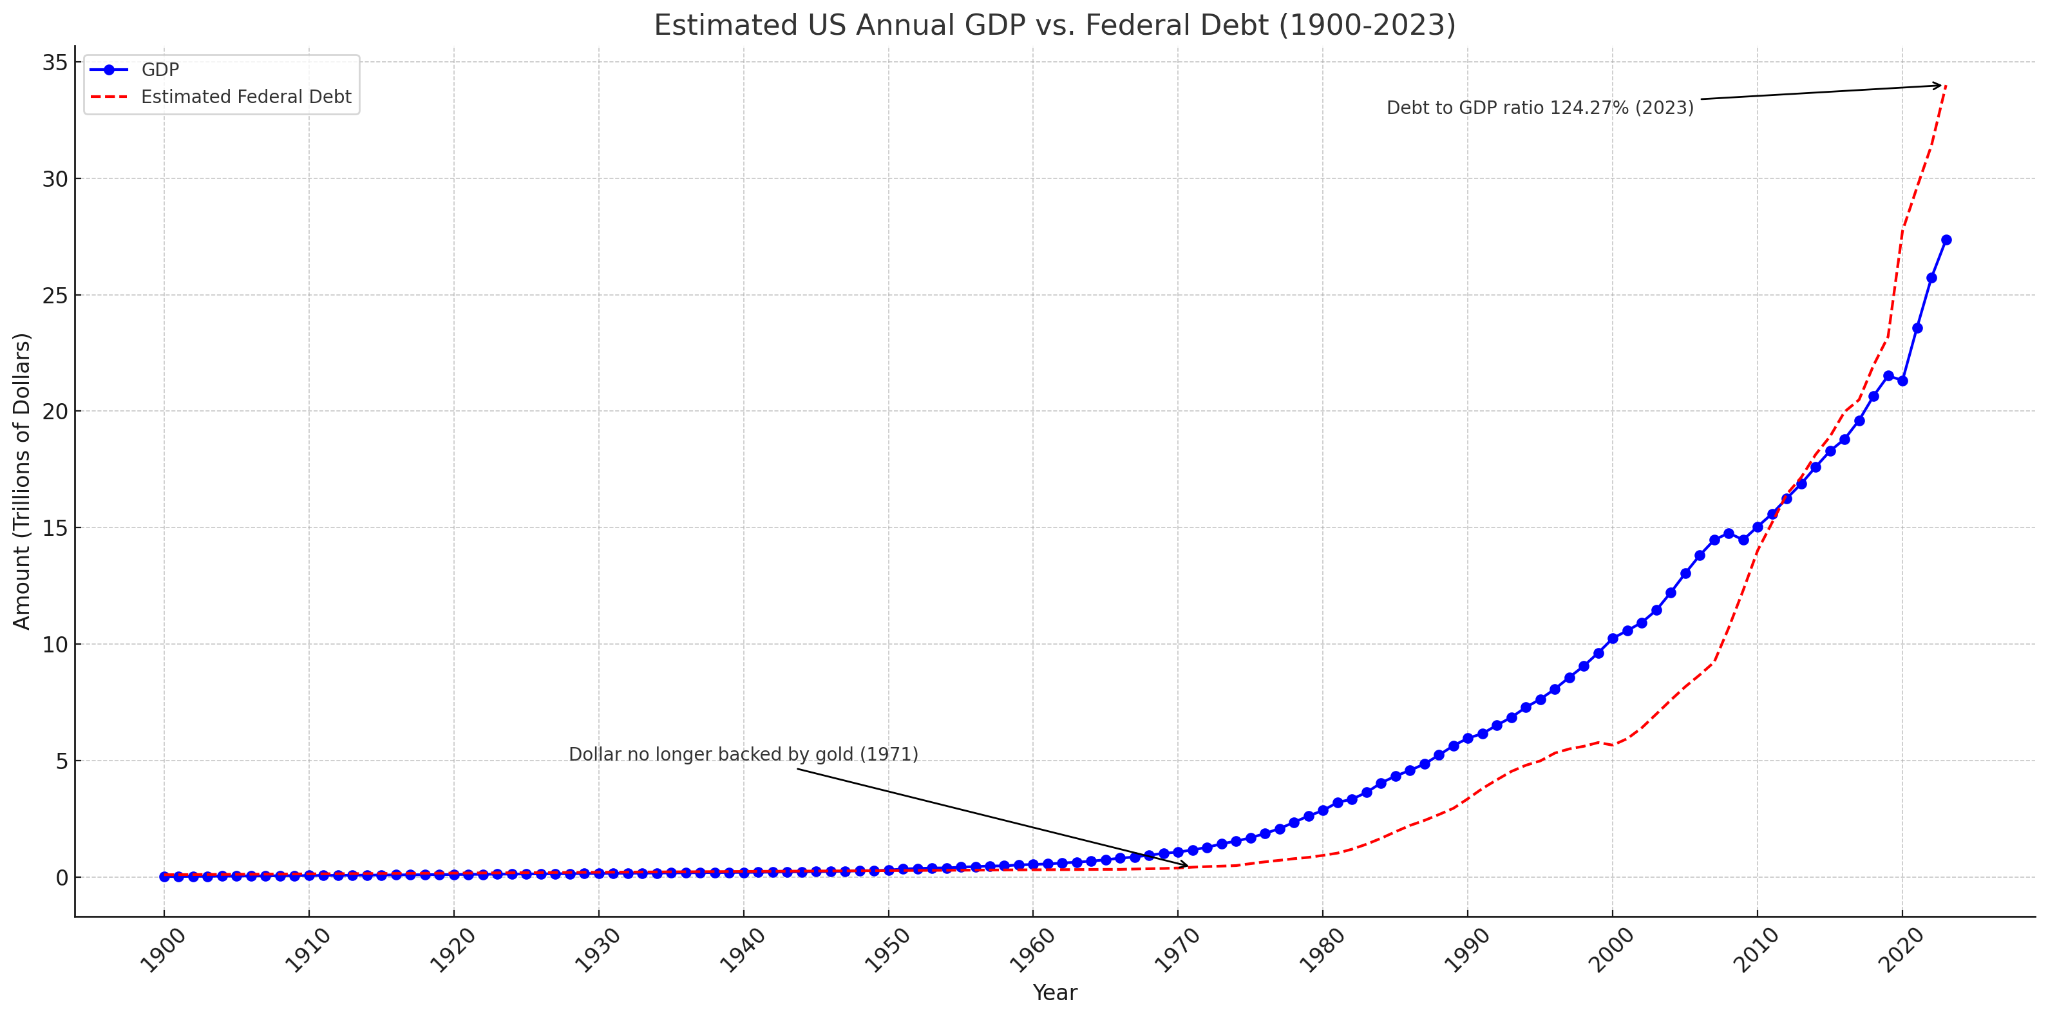
Updated version coming soon. We're sourcing long-run GDP and debt series back to 1900.
Act 10 · Chart 10 of 17
US GDP and Debt (1870–1913)
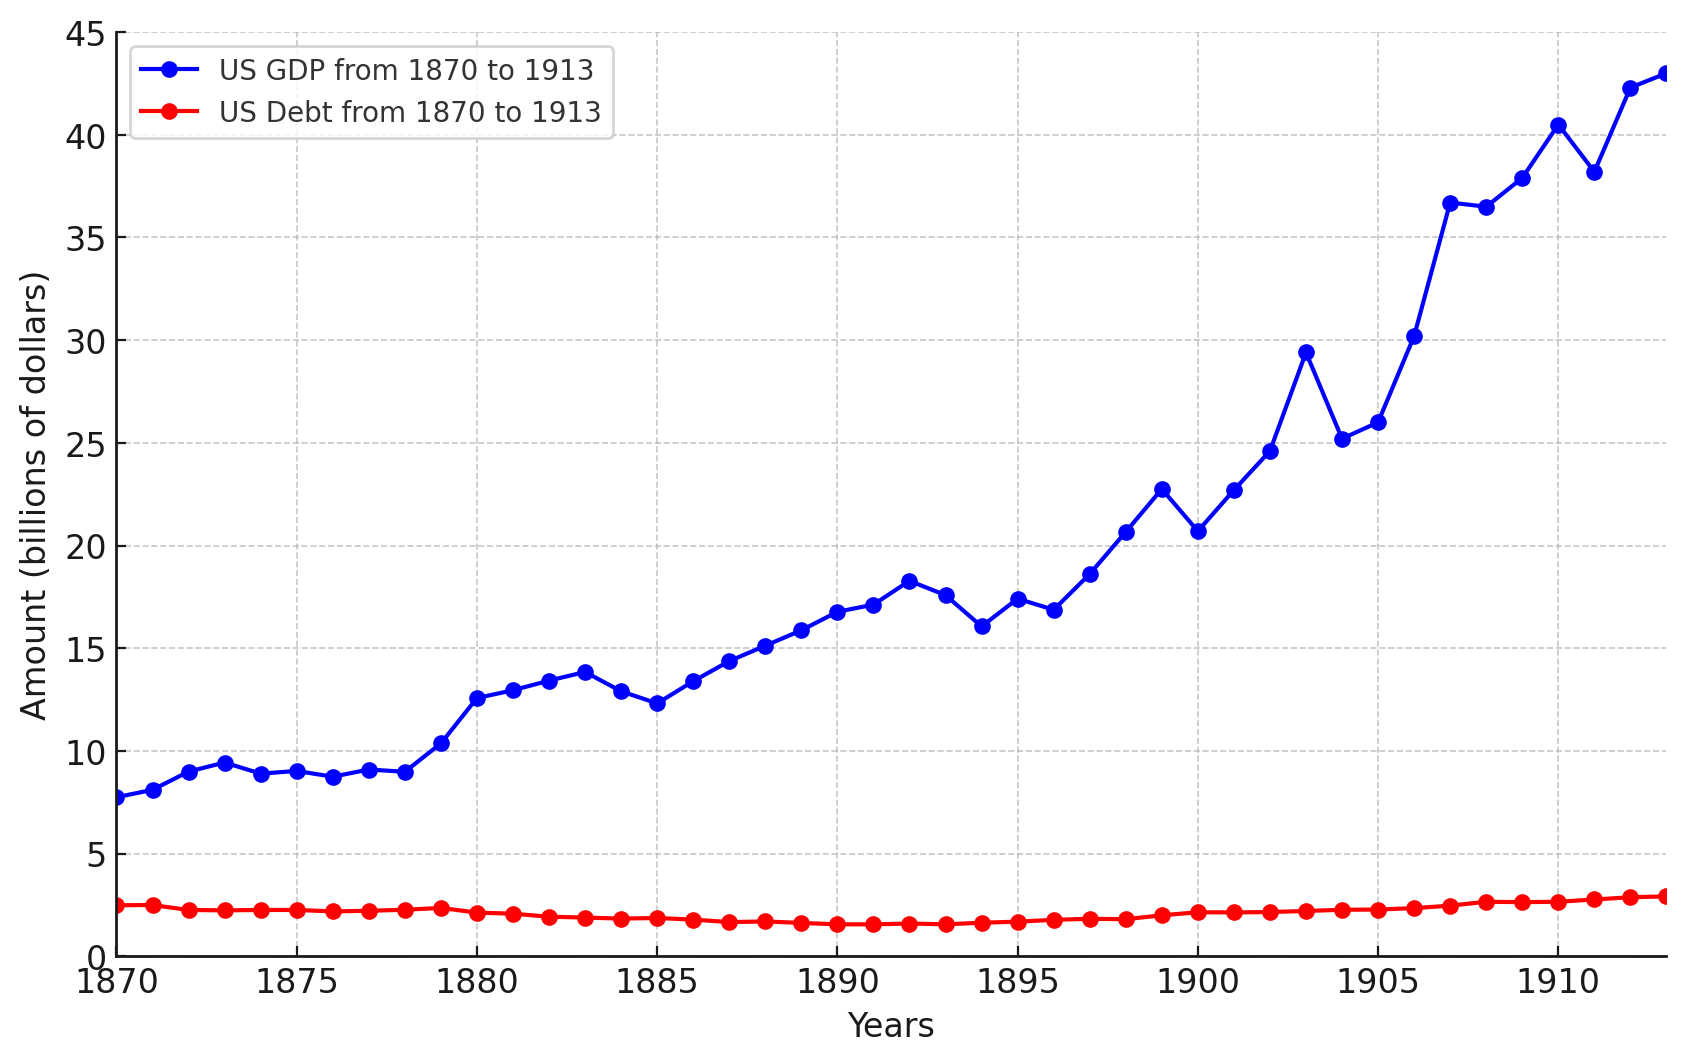
Historical chart: America before the Federal Reserve and the income tax.
Act 11 · Chart 11 of 17
US Federal Debt, Consumer Debt, and Tax Revenue (2000–2026)
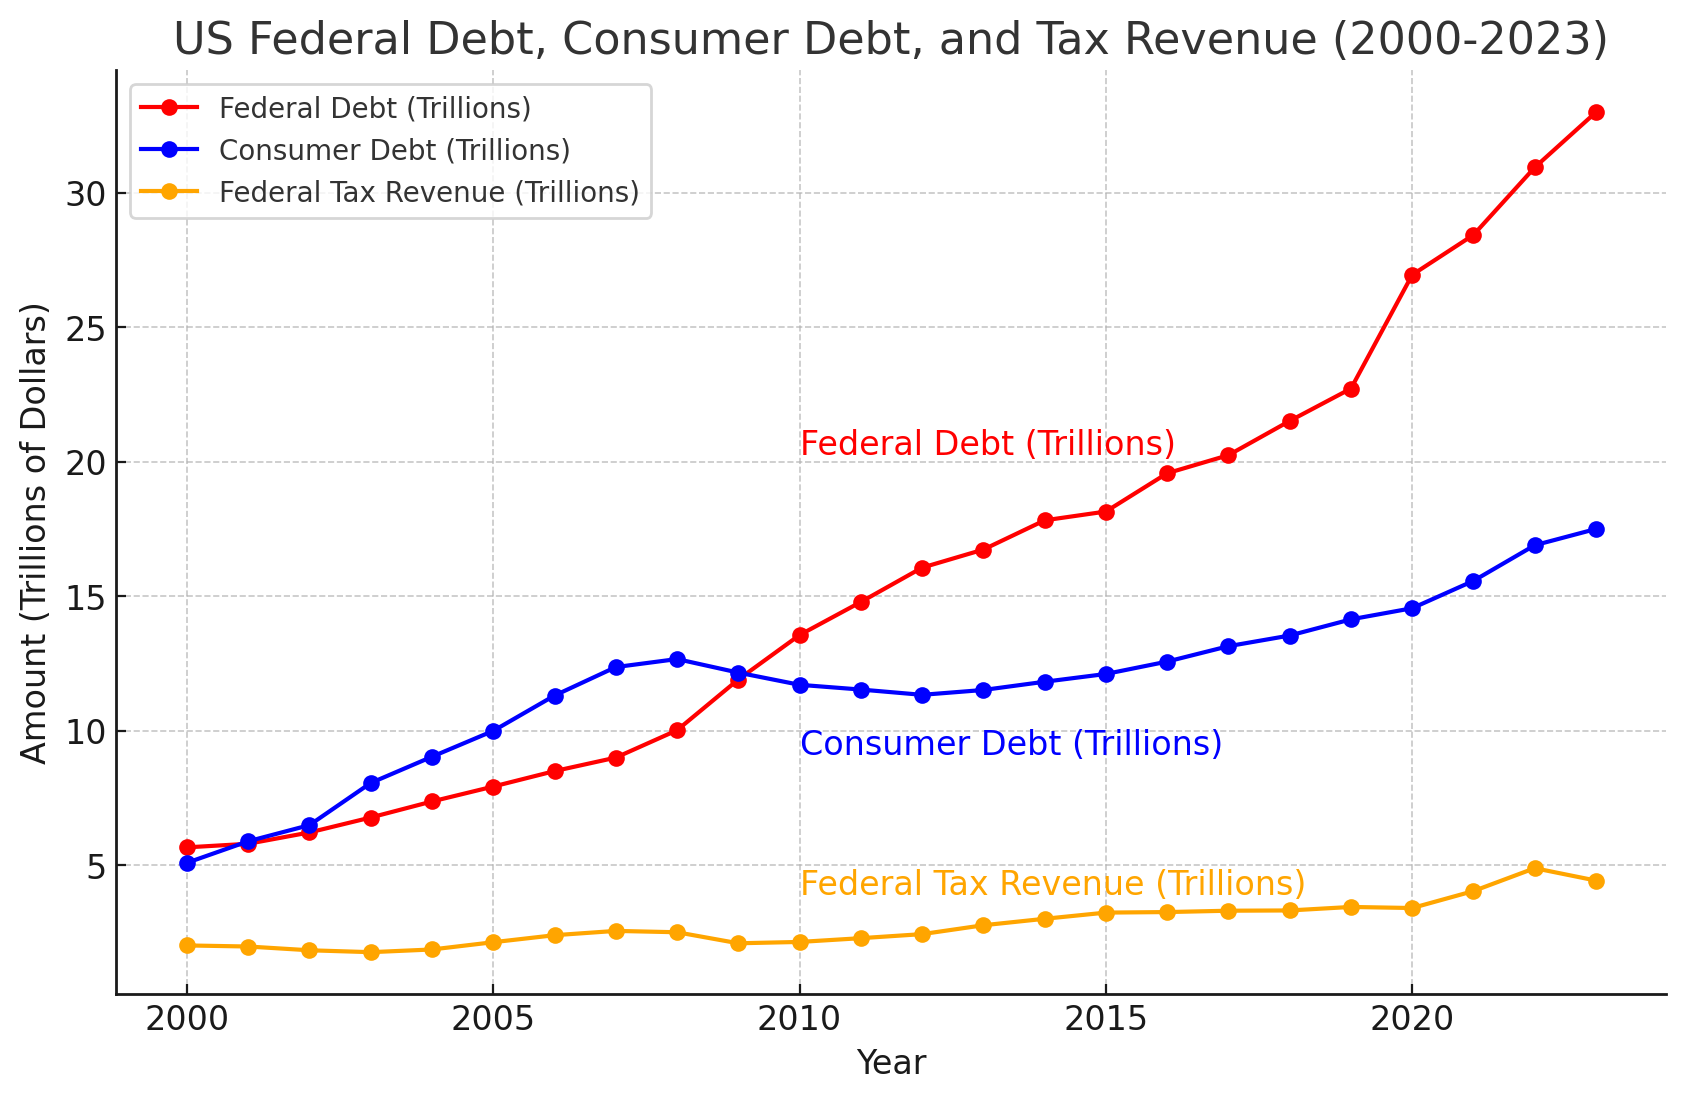
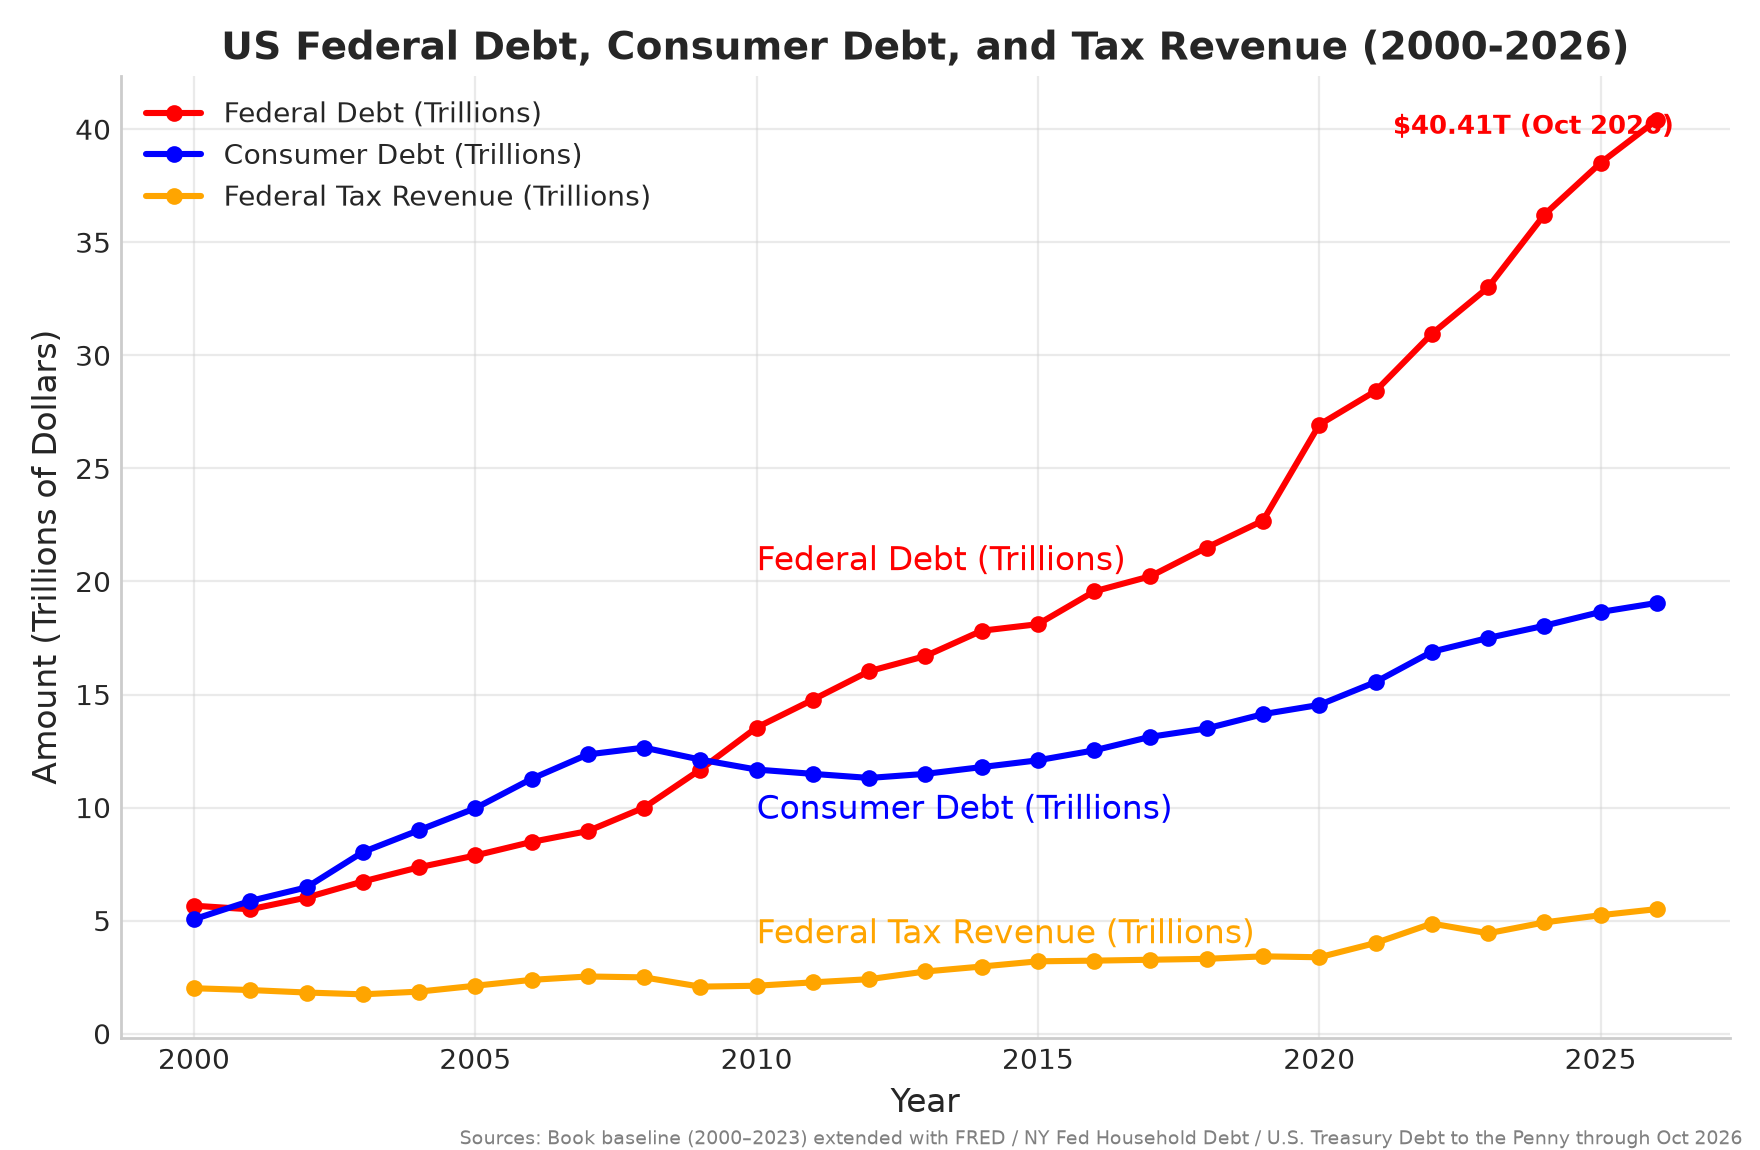
Federal debt hit $40.41 trillion on Oct 21, 2026 (U.S. Treasury). Debt keeps compounding far faster than the revenue meant to pay it.
Act 11 · Chart 12 of 17
US Personal Savings vs. Interest on Debt (2000–2026)
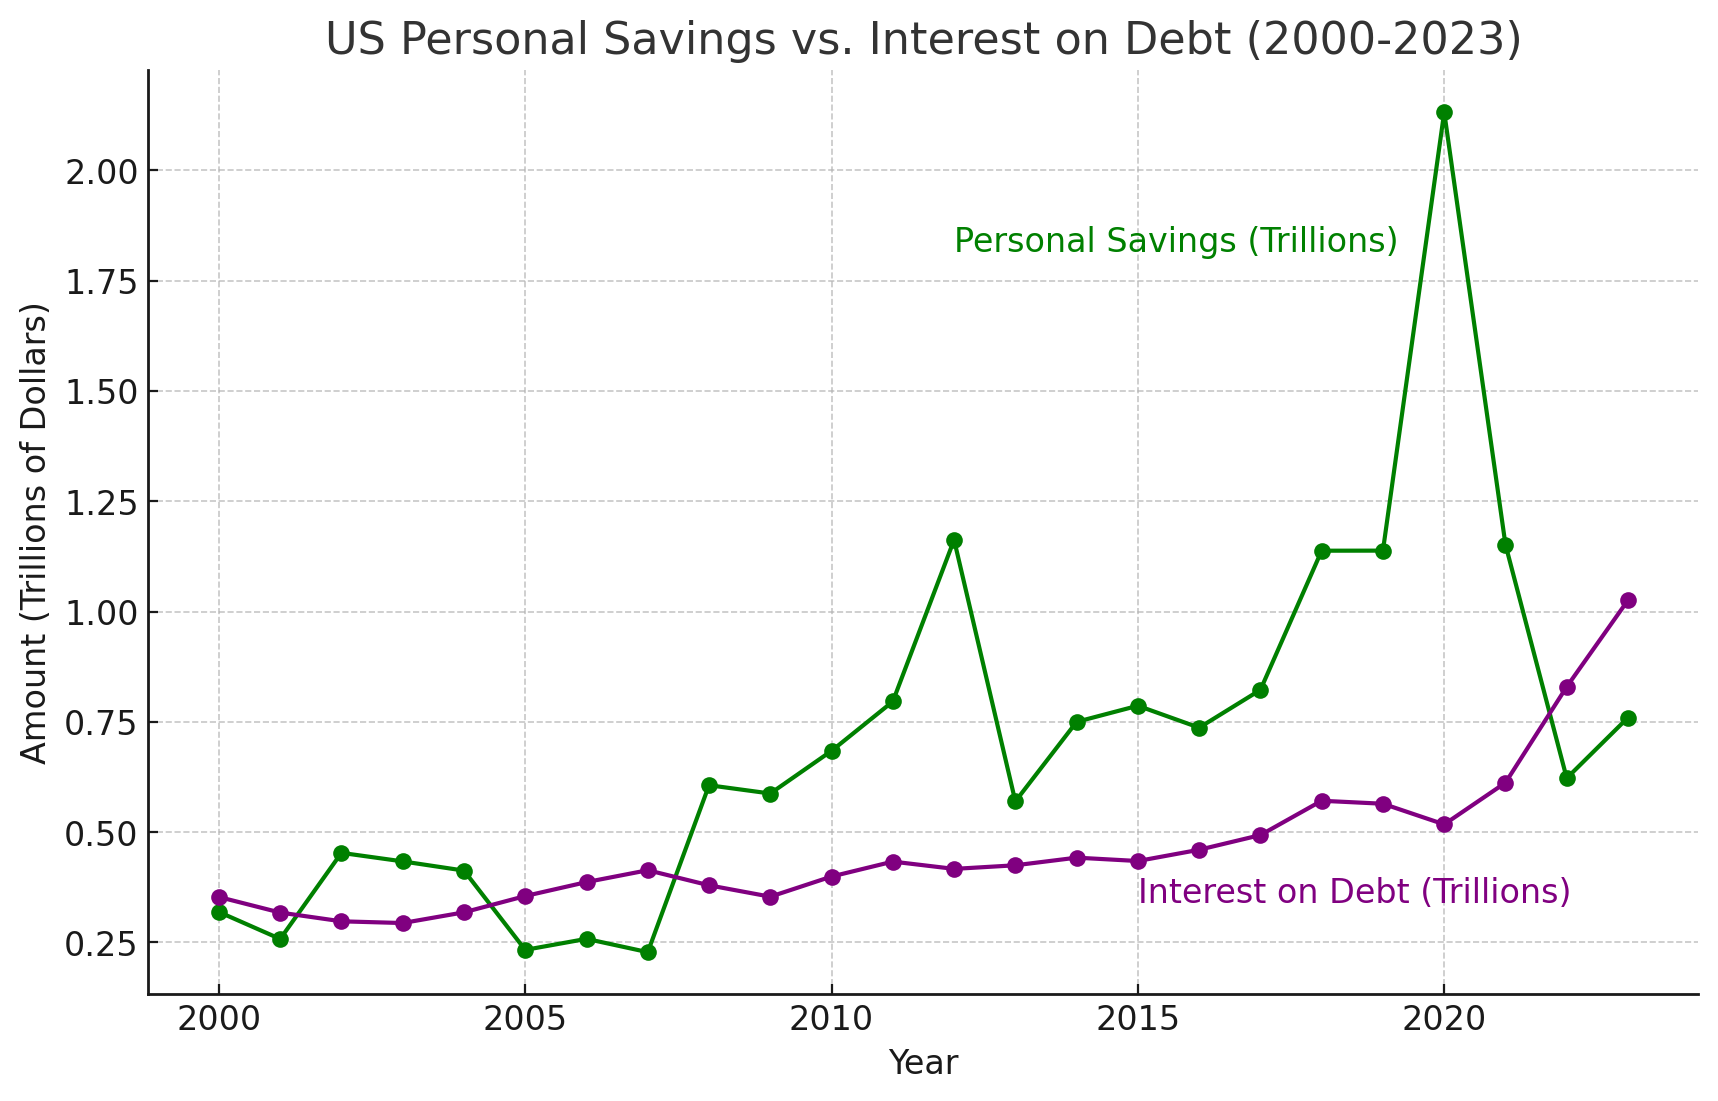
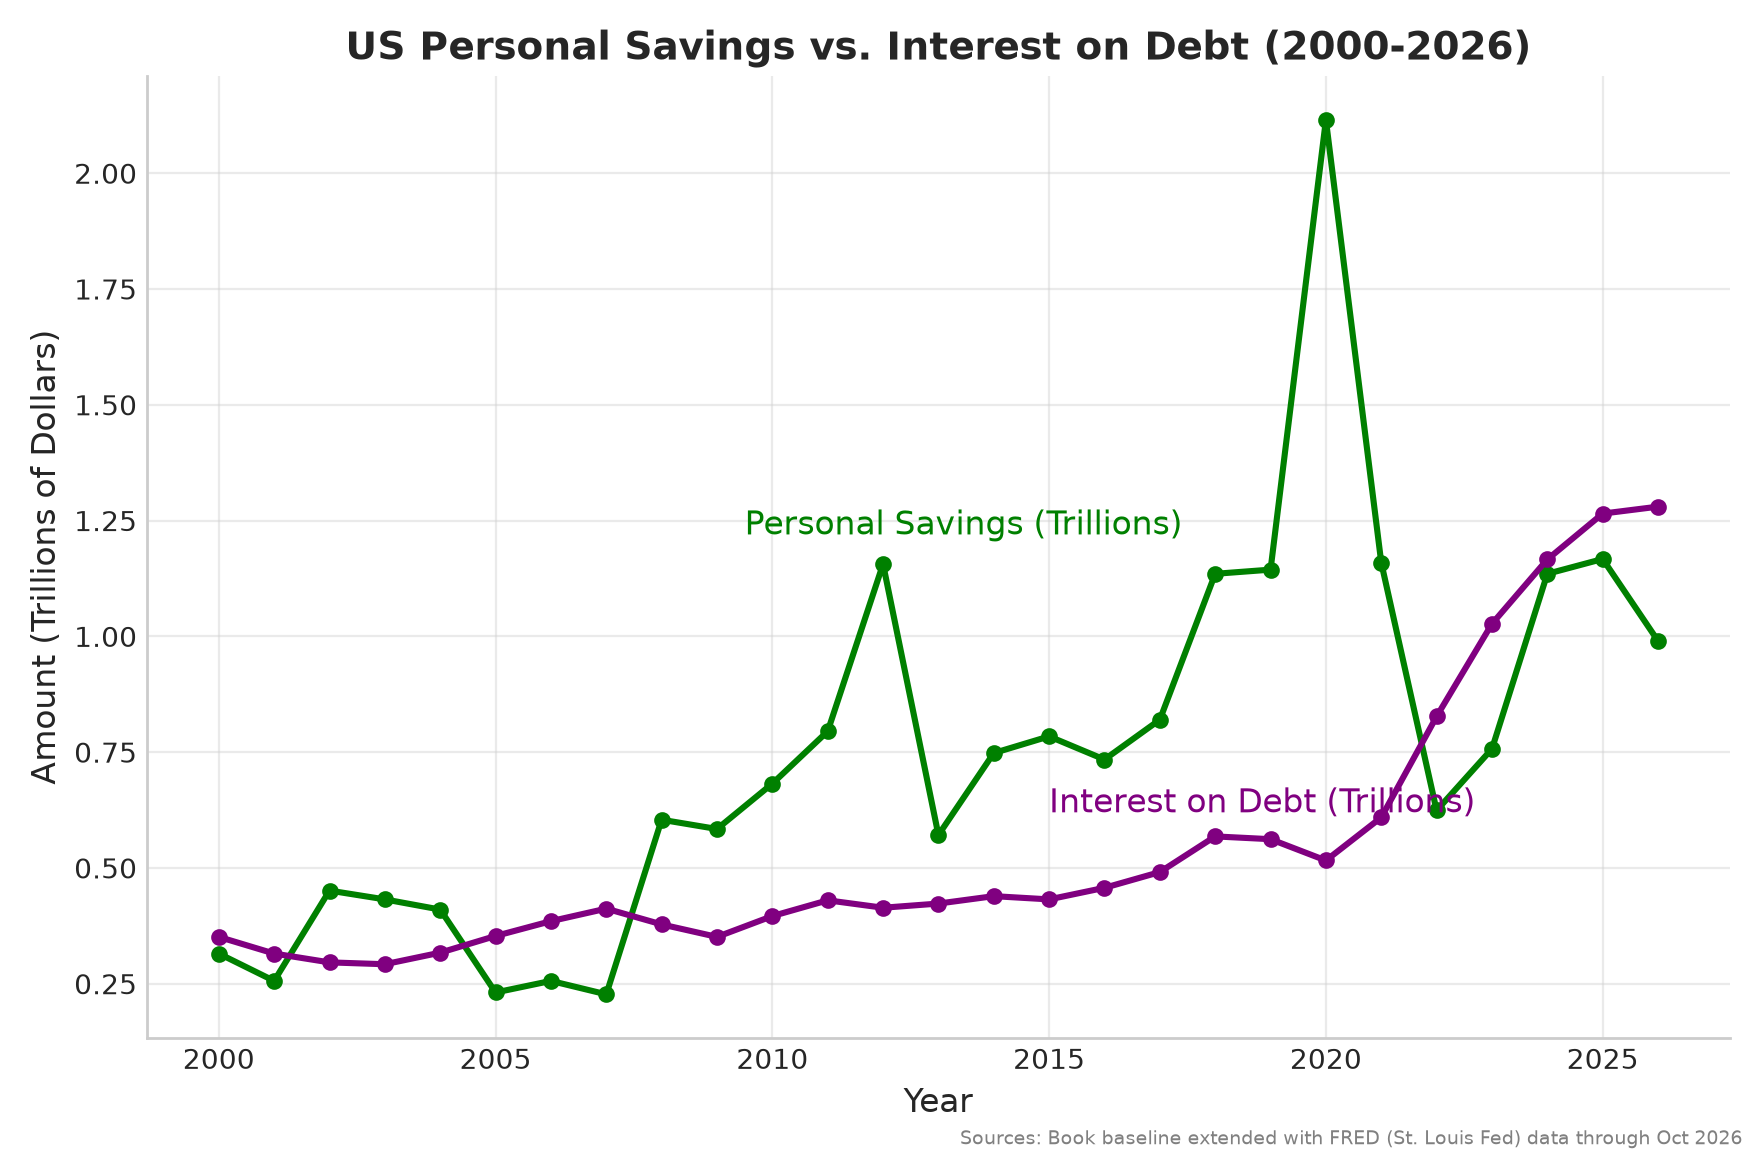
Interest on the national debt now rivals what all American households save in a year.
Act 11 · Chart 13 of 17
Israel Inflation (1970–1990)
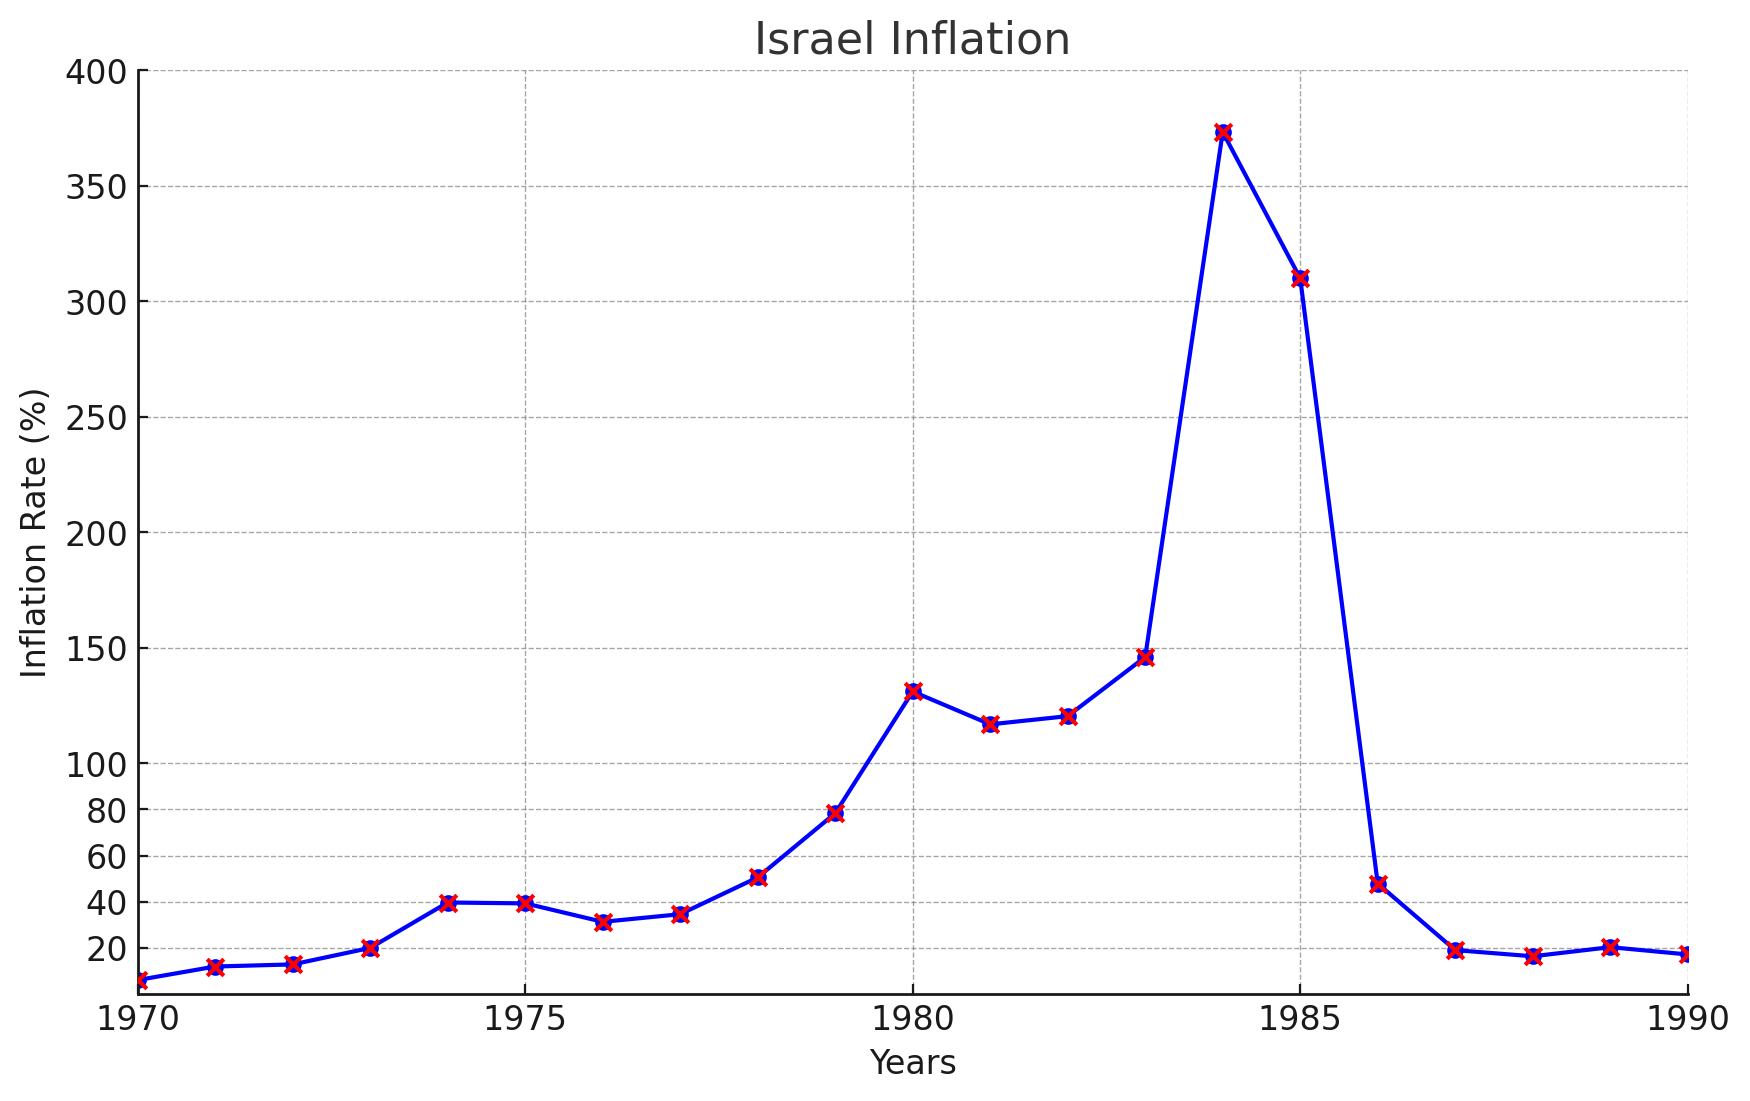
Historical chart: government-reported inflation rates.
Act 11 · Chart 14 of 17
Israel Inflation Applied to US Debt vs. a 30% Max-Inflation Scenario
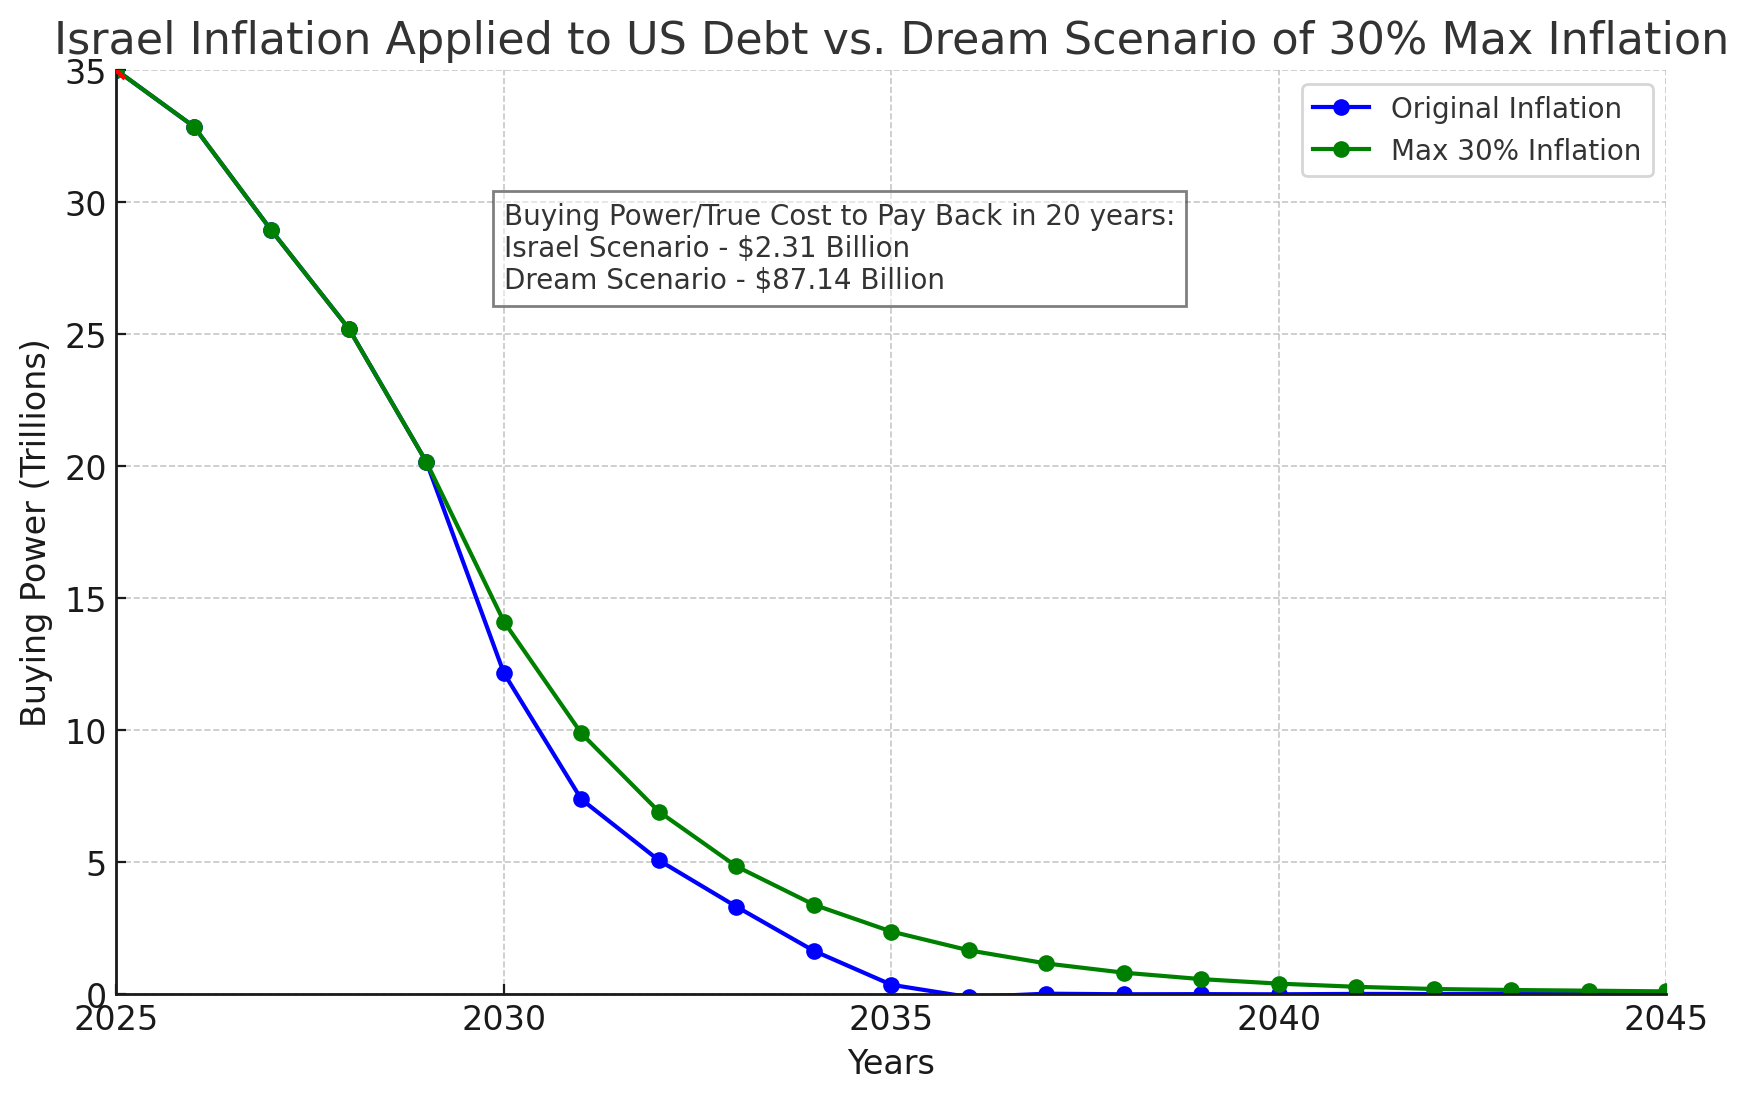
Projection: an illustrative 20-year scenario from the book, not a forecast. No update applies.
Act 11 · Chart 15 of 17
Buying Power of $1 Million: Original Inflation vs. 10% Investment Return
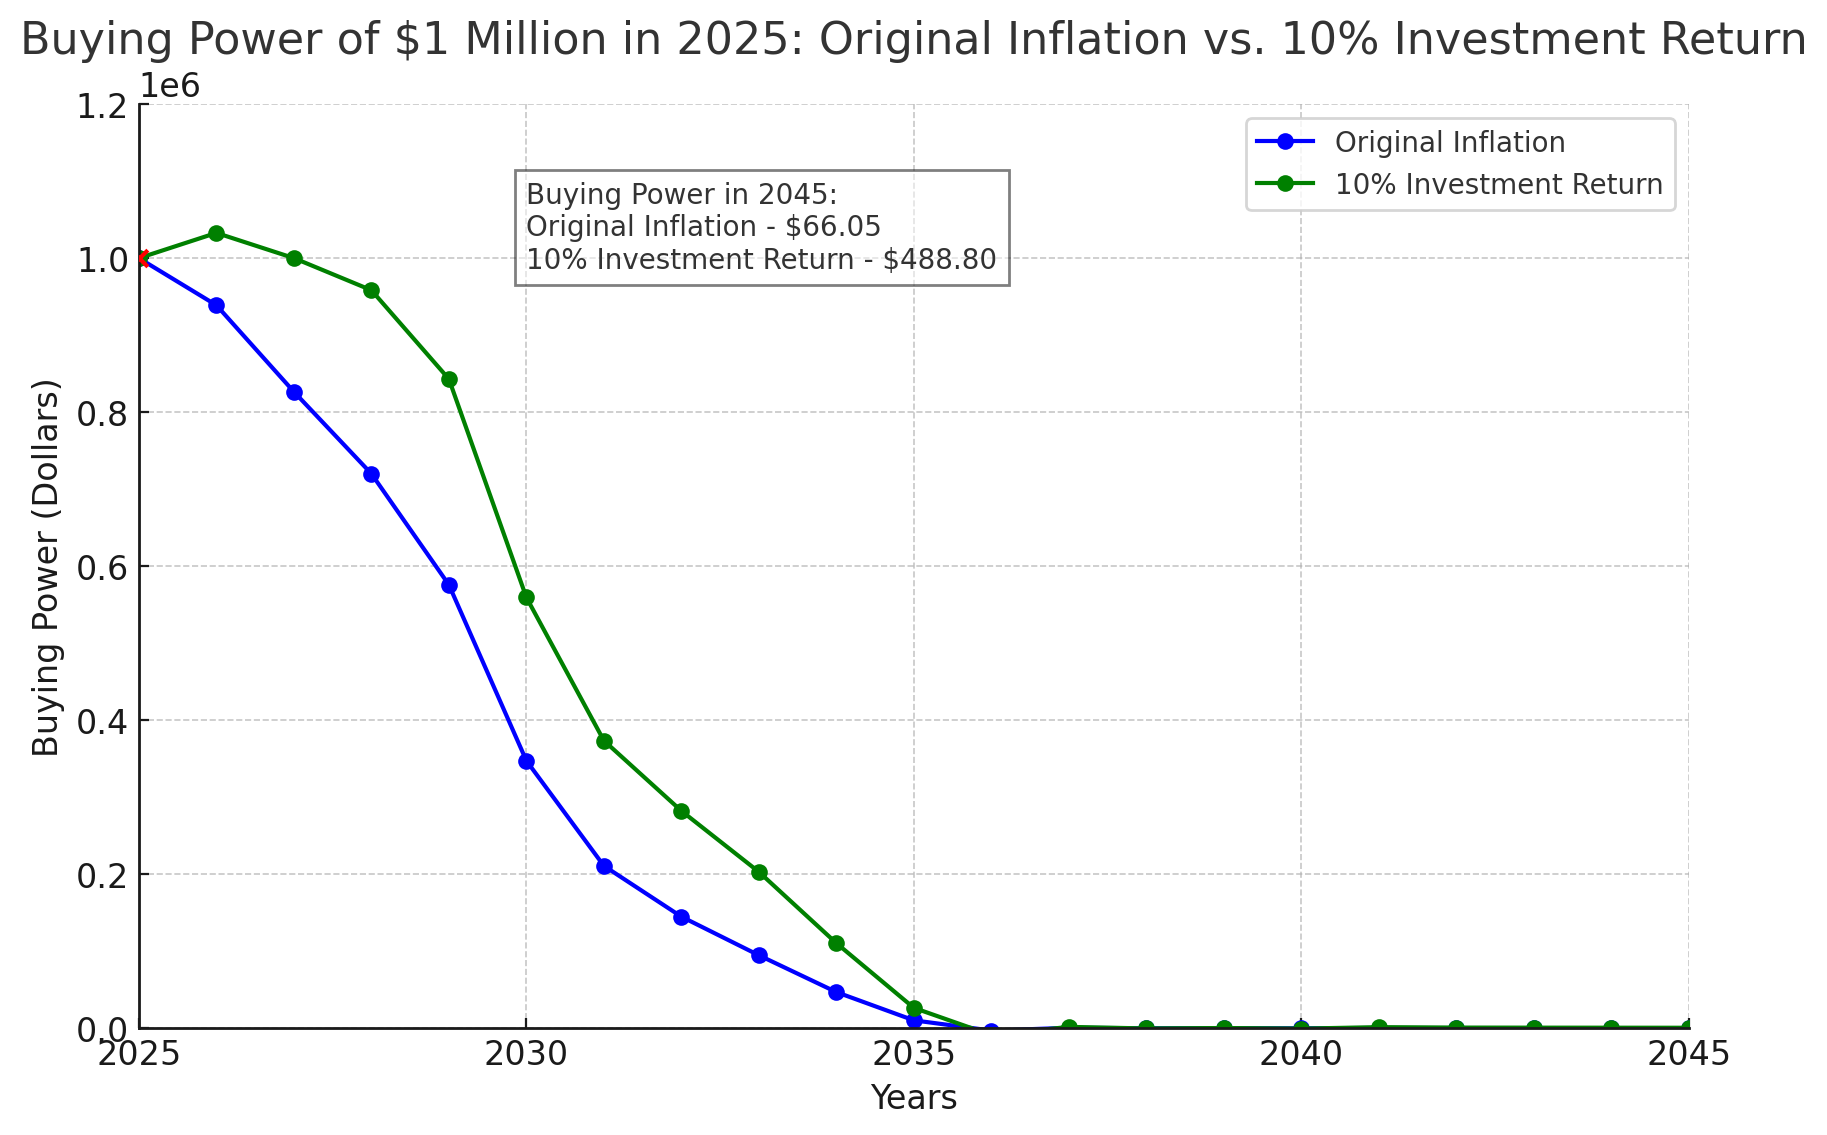
Projection: an illustrative scenario from the book. No update applies.
Act 11 · Chart 16 of 17
Comparison of Internet, WWW, and Bitcoin Adoption from Year 1
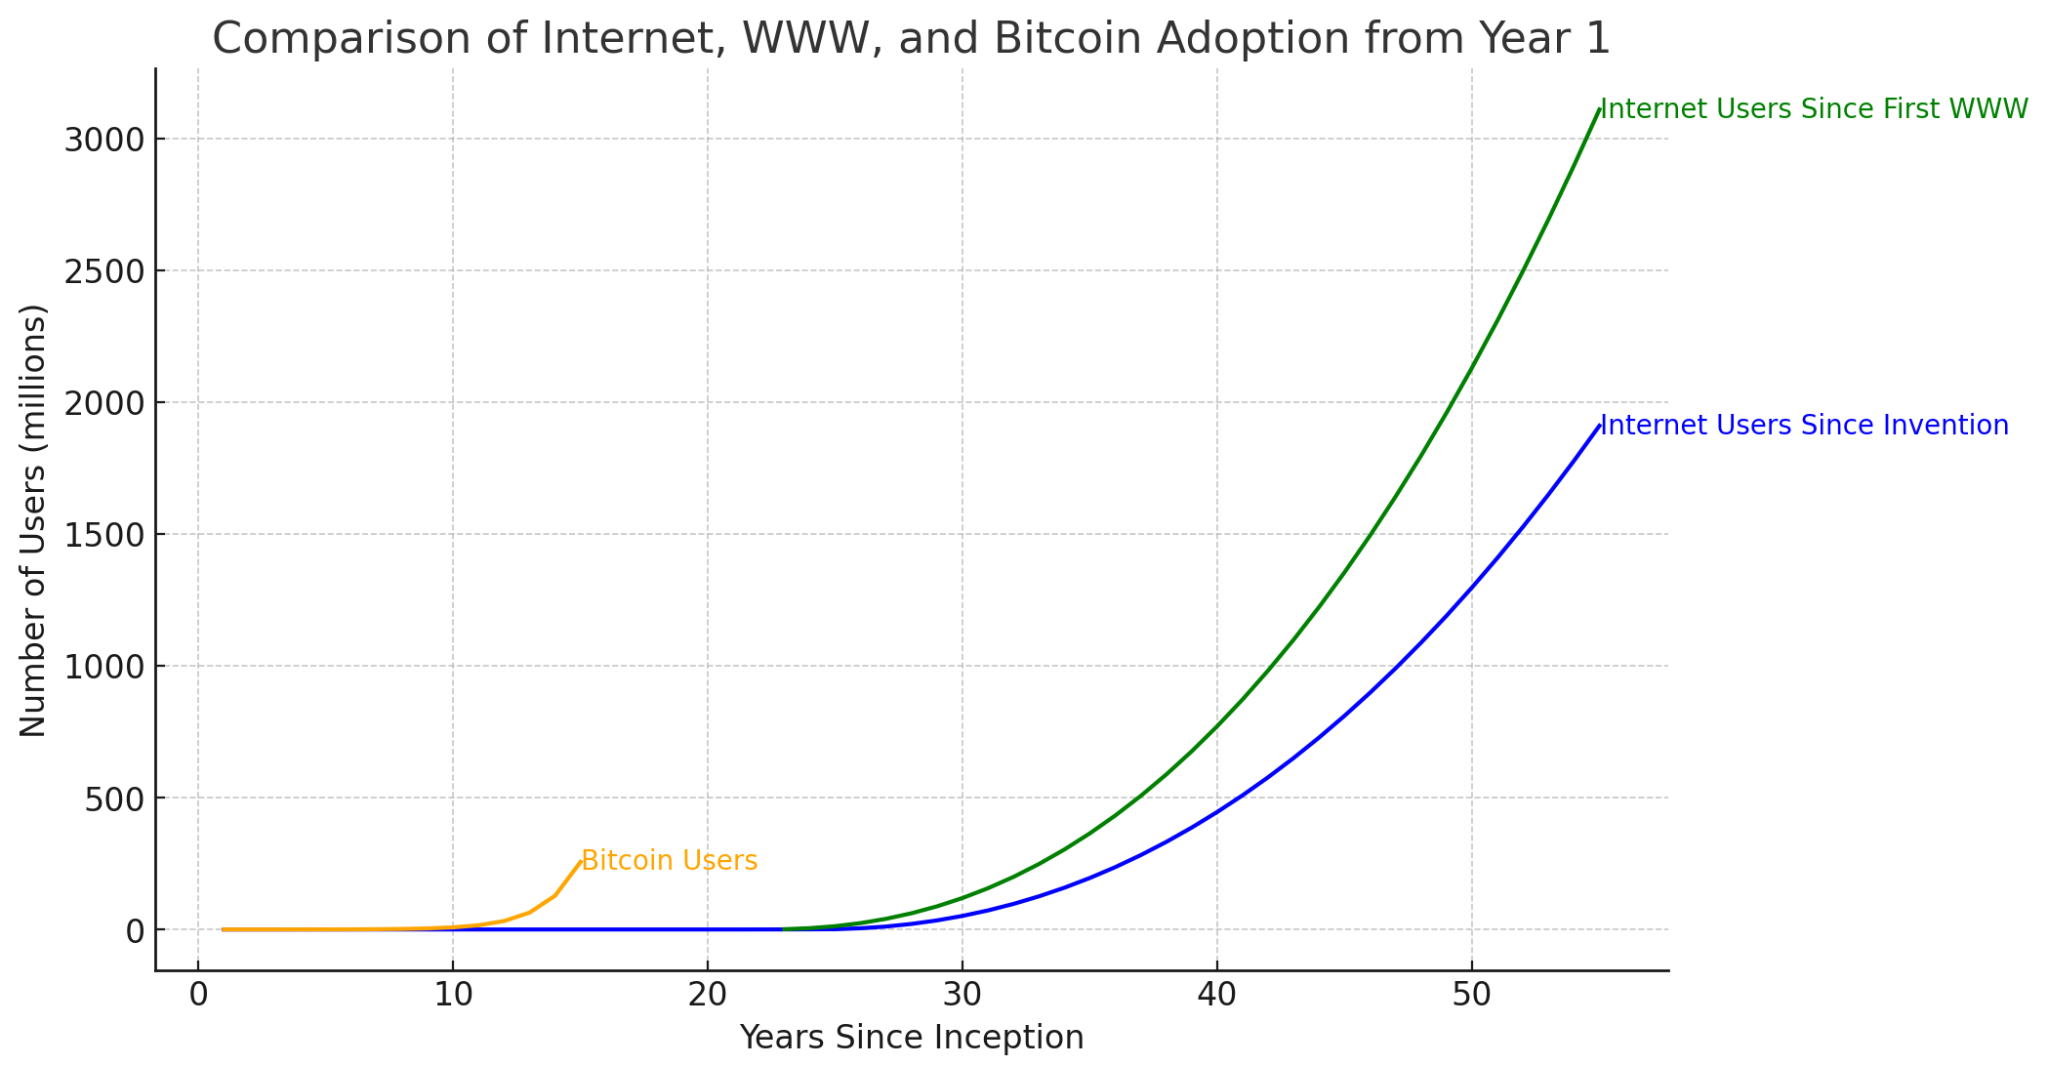
Updated version coming soon. We're confirming current Bitcoin user estimates.
Act 11 · Chart 17 of 17
Value of 2 BTC Over Time (Feb 9 each year)
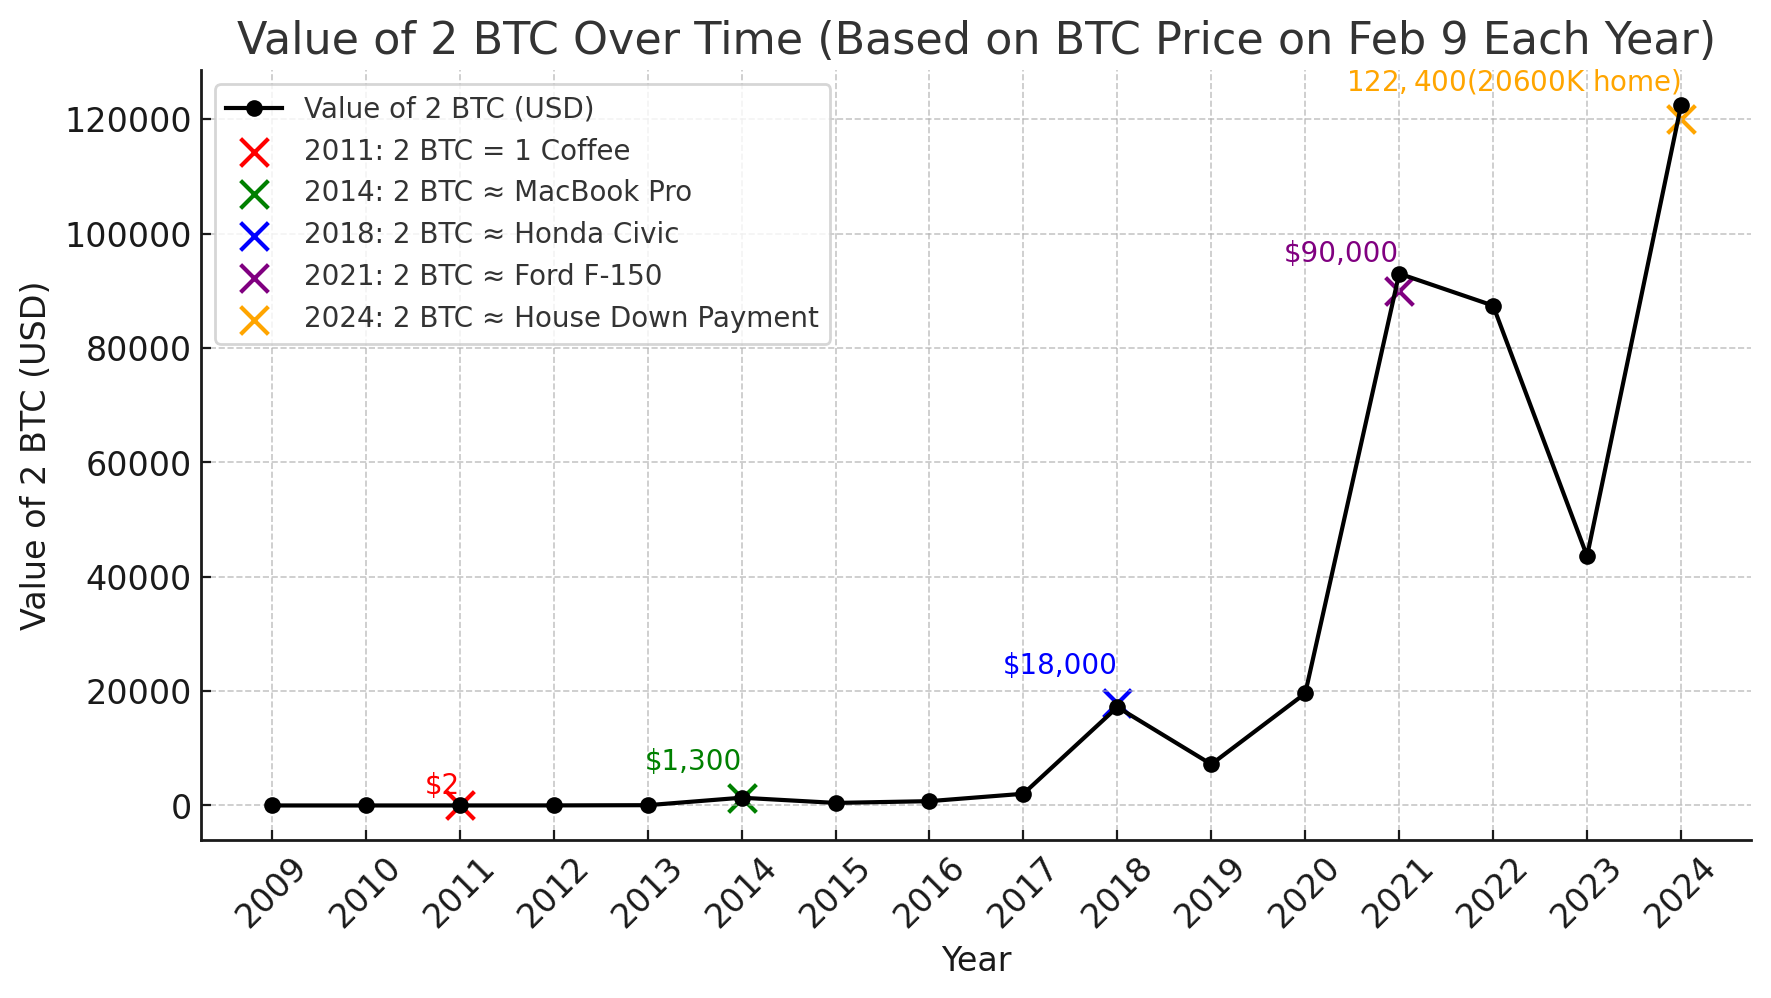
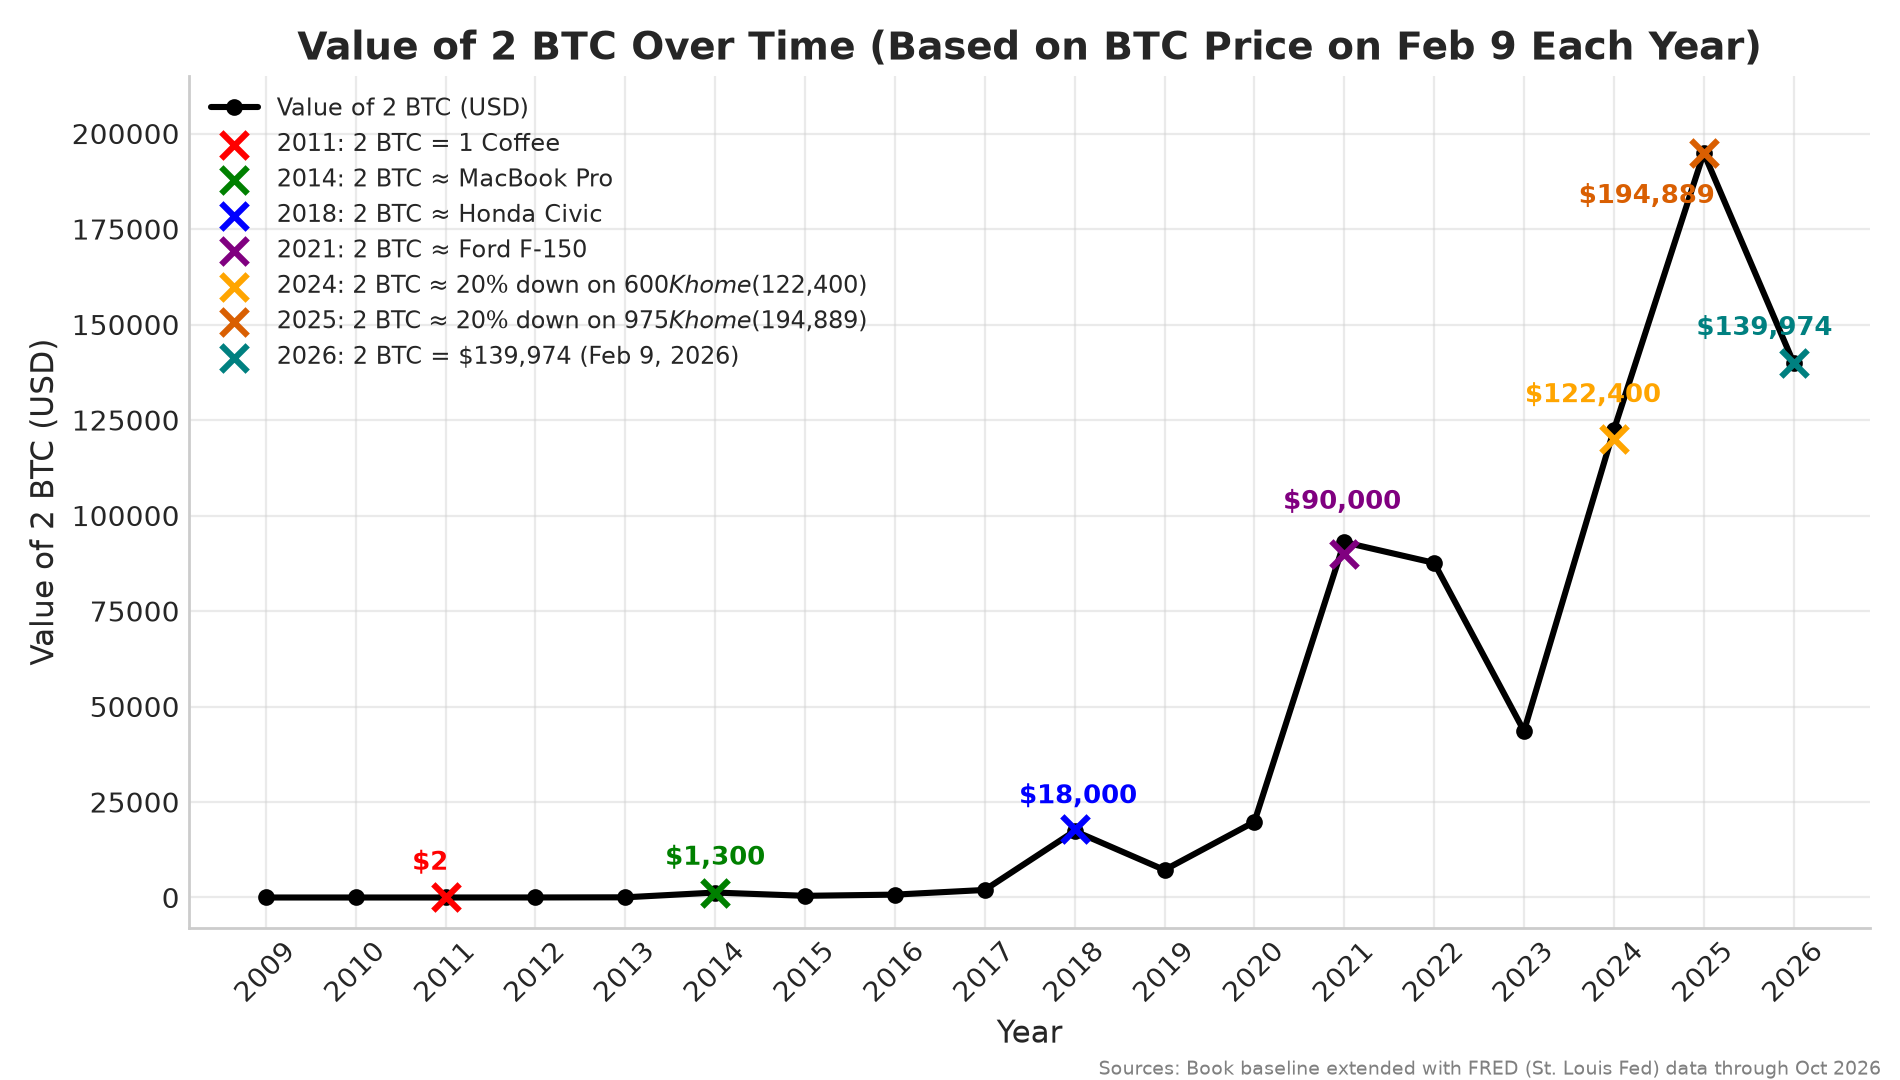
Two bitcoin bought a coffee in 2011. On Feb 9, 2025, they were worth about $195,000. Past performance is not indicative of future results.
Recommended Resource · Partner
Protecting Meaningful Bitcoin: Unchained
Once your Bitcoin position grows beyond beginner amounts, how you hold it matters. Unchained specializes in collaborative multisig custody, inheritance planning, and Bitcoin IRAs—so you hold your own keys without single points of failure.
Explore Unchained See all recommended tools and resources on our Recommended Resources page.
Disclosure: This is a referral partner link; using it may support our work at no extra cost to you.
The charts show what happened. The book shows why, and what your family can do about it.
A page-turning story built on real history, in plain English.
Kindle on Amazon PaperbackUpdated data: Federal Reserve Bank of St. Louis (FRED) series ASPUS, GFDEBTN, FYFR, PMSAVE, A091RC1Q027SBEA and CBBTCUSD, and Federal Reserve Bank of New York Household Debt and Credit Report, retrieved Oct 23, 2026. 2026 federal debt from U.S. Treasury Debt to the Penny ($40,413,639,012,305.97 on Oct 21, 2026). Bitcoin supply follows the protocol's issuance schedule. Not financial advice. Past performance is not indicative of future results.